6. Data Display (Data Consumers)
The data that the Inca depot stores can be displayed in many ways, such as current status reports, historical graphs, and customized status information. An Inca data consumer is anything that retrieves data from the depot and displays it (e.g. a JSP, SQL query, CGI, etc.). The Inca depot provides access to stored data via Perl and Java client APIs (see Section 7.2.3).
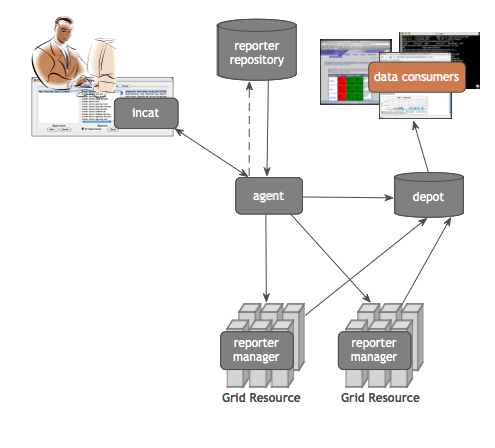
The data consumer packaged with Inca is a collection of JavaServer Pages (JSP) and associated files. The consumer is installed in $INCA_DIST/webapps/inca and is deployed with Jetty when the consumer is started (e.g., ./bin/inca start consumer). The consumer listens on ports 8080 (HTTP) and 8443 (HTTPS) unless $INCA_DIST/etc/jetty.xml is edited as described in Section 6.12.
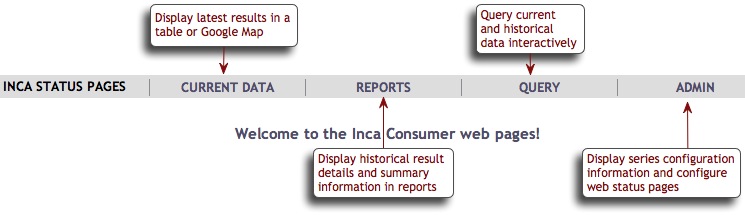
The default consumer's JSPs query the depot for XML results and either apply XSL to them in order to display HTML status pages or parse out data and display it in graphs. The figure below shows the default menu header. Each menu item invokes a JSP as described in the sections below.
6.1. Current Data
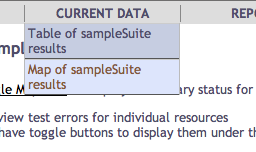
The default page header navigation contains links to tabular and map view result summaries for the sample suite. To add other current data pages under this heading (e.g., result summary tables for additional suites), customize the header.xsl file as described in Section 6.9.3.
6.1.1. Tabular Suite Summary View
The first item in the CURRENT DATA menu executes status.jsp with default.xsl to create a summary table of suite results. This JSP takes comma-delimited lists in its suiteNames and optional resourceIds parameters that specify the suites and resources to be shown. The default installation invokes http://localhost:8080/inca/jsp/status.jsp?suiteNames=sampleSuite&resourceIds=defaultGrid, producing an image similar to this one:
6.1.2. Map View using Google Map API
6.1.2.1. Overview
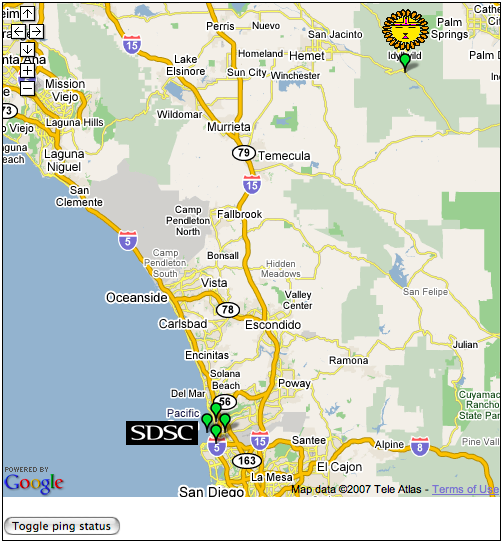
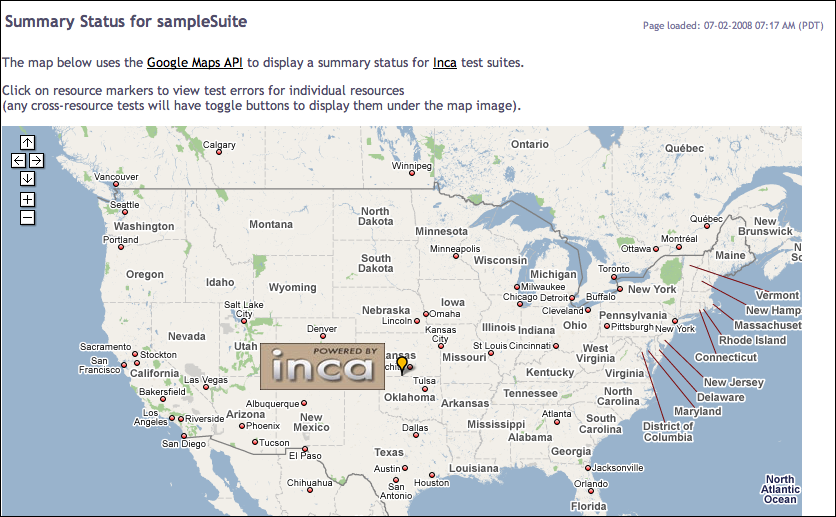
The second item in the CURRENT DATA menu executes status.jsp using google.xsl to display a map that provides a summary of the current status of resources. For each resource, the map view gives the percentage of reports passed, number of passed reports, number of failed reports, and a list of the failed tests with a link to each report details page. A resource is represented on the map as a marker and colored red, green, or orange based on the number of tests that have passed and/or failed. The figure below shows the Inca Google map view for the NEON testbed (four resources at SDSC and one resource at James Reserve). All resources are passing their tests, so every resource marker is green.
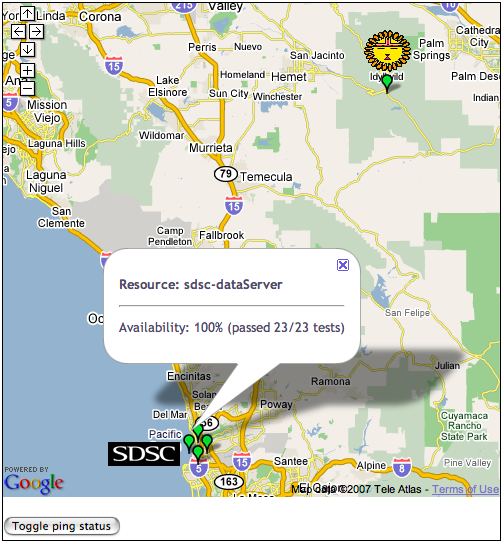
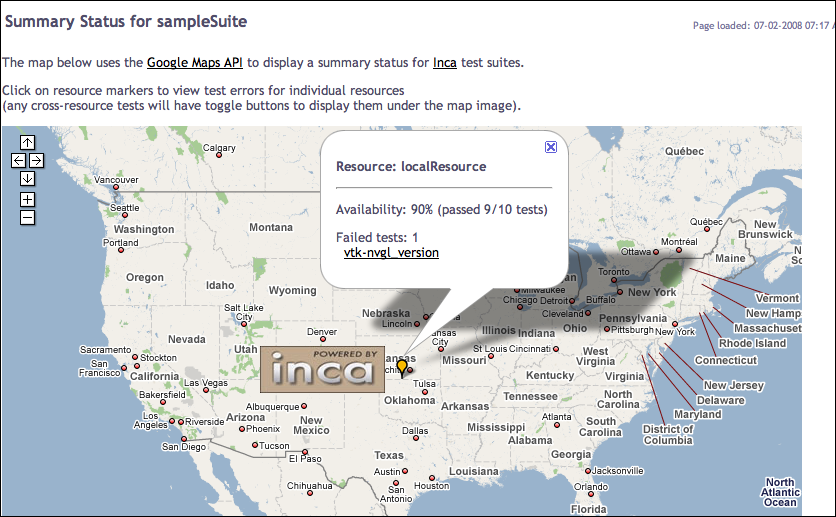
Clicking on a marker displays a pop-up with the name of the resource and its status information as show below.
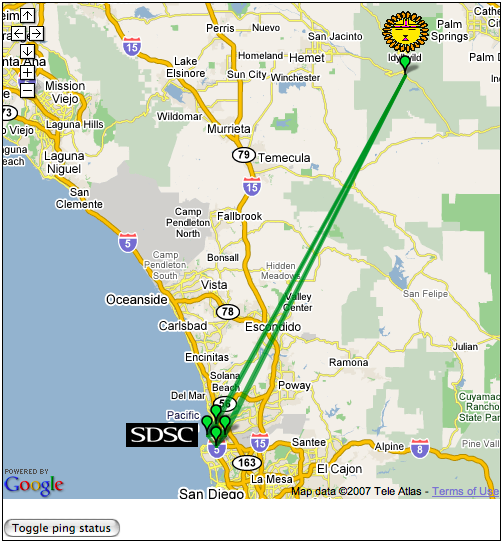
Clicking on the "Toggle ping status" button displays the status of the cross-site ping test as show below.
6.1.2.2. Setting up Google Map View
The Inca map views can be configured using the page described in Section 6.4.2. Use the options in Section 6.1.2.2.1 to configure maps for your site.
Next give the map generator the locations of your resources. Use the configuration page to add/edit sites and resource like the one below:
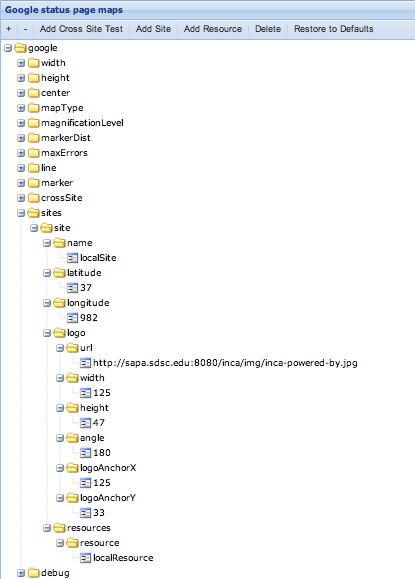
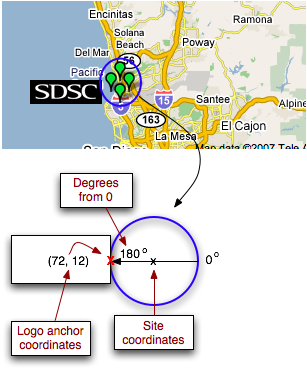
Provide a site name, latitude/longitude coordinates and a list of resources for each site. Optionally, you can also specify a logo for the site. Specify the height and width of the logo in pixels, angle from 0 degrees, and logo anchor coordinates (logoAnchorX/logoAnchorY) as shown in the figure below:
6.1.2.2.1. Google Map Options
width/height: The size of the map graphic (in pixels) that will be generated. By default the map is 800x500.
center: The center of the map in latitude/longitude coordinates. By default, the center of the map corresponds to the center of the U.S.
mapType: Type of map to display. By default the map is google.maps.MapTypeId.TERRAIN.
google.maps.MapTypeId.ROADMAP: displays the default road map view.
google.maps.MapTypeId.SATELLITE: displays Google Earth satellite images.
google.maps.MapTypeId.HYBRID: displays a mixture of normal and satellite views.
google.maps.MapTypeId.TERRAIN: displays a physical map based on terrain information.
magnificationLevel: The initial magnification, or zoom level, of the map expressed as a number between 1 and 12. Zoom level 1 displays the entire world, while zoom level 12 allows you to read street names.
markerDist: The distance between resource markers at a site. If there is more than one resource at a particular site, the resource markers will be arranged in a circle around the site center. By default, the distance between the markers will be determined so that the markers do not overlap each other.
maxErrors: The maximum number of errors to display in the info window that is displayed when a resource is clicked.
line: For cross-site tests, a line will be displayed between the two sites to indicate the test status. If a suite contains a cross-site test, a button will be displayed below the map named "Toggle <testName> status". When the button is clicked, the status of an individual cross-site test will be expressed as a line in between the source resource and the destination resource. The color of the line used to represent the test status can be customized. By default, green represents the test passed and red represents the test failed. See "crossSite" below to specify the tests you want displayed.
marker: Customize the look of the icon marker used to represent a resource on the map. A resource is represented by a Google marker and the color varies based on the number of tests that it failed: all tests passed =
 ,
at least one test failed =
,
at least one test failed =  ,
all tests failed =
,
all tests failed =  .
. Suppose you wanted to change the icons displayed to weather icons so that all tests passed =
 ,
at least one test failed =
,
at least one test failed =  ,
all tests failed =
,
all tests failed =  . You would
first find the size of the icons and modify the iconWidth and iconHeight (in this case the weather icons are 32x32 pixels).
Then pick the anchor point for the icon to be placed in relation to the resource's place on the map. Since we want the middle of the icon to be placed on the map, we choose the coordinates (16, 16) and modify iconAnchorCoord.
Next determine the anchor point for the info window to pop up relative to the icon. Since we want the info window to appear in the top middle, we choose the coordinates (16, 10) and modify iconInfoWindowAnchorCoord. Then construct the icon URLs
using the three weather icons located on the Google server at: http://maps.google.com/mapfiles/kml/pal4/icon33.png, http://maps.google.com/mapfiles/kml/pal4/icon34.png, http://maps.google.com/mapfiles/kml/pal4/icon36.png. Set the following values: iconUrlPrefix="http://maps.google.com/mapfiles/kml/pal4/icon", iconStatus->fail="36", iconStatus->pass="33", iconStatus->warn="34", iconUrlSuffix=".png".
Finally, specify the url for the shadow icon by setting shadowIconUrl="http://maps.google.com/mapfiles/kml/pal4/icon36s.png".
. You would
first find the size of the icons and modify the iconWidth and iconHeight (in this case the weather icons are 32x32 pixels).
Then pick the anchor point for the icon to be placed in relation to the resource's place on the map. Since we want the middle of the icon to be placed on the map, we choose the coordinates (16, 16) and modify iconAnchorCoord.
Next determine the anchor point for the info window to pop up relative to the icon. Since we want the info window to appear in the top middle, we choose the coordinates (16, 10) and modify iconInfoWindowAnchorCoord. Then construct the icon URLs
using the three weather icons located on the Google server at: http://maps.google.com/mapfiles/kml/pal4/icon33.png, http://maps.google.com/mapfiles/kml/pal4/icon34.png, http://maps.google.com/mapfiles/kml/pal4/icon36.png. Set the following values: iconUrlPrefix="http://maps.google.com/mapfiles/kml/pal4/icon", iconStatus->fail="36", iconStatus->pass="33", iconStatus->warn="34", iconUrlSuffix=".png".
Finally, specify the url for the shadow icon by setting shadowIconUrl="http://maps.google.com/mapfiles/kml/pal4/icon36s.png".iconWidth/iconHeight: size of icon in pixels.
iconAnchorCoord: the coordinates of point inside the icon to be used for the anchor.
iconInfoWindowAnchorCoord: where the anchor point for the info window should appear inside the icon.
iconUrlPrefix/iconStatus/iconUrlSuffix: set of 3 icons to indicate the different resource status: pass/fail/warn based on the number of tests the resource passes. The url for the 3 different images should have the same url pattern constructed by concatenating <iconUrlPrefix>, <iconStatus>/<fail|pass|warn>, and <iconUrlSuffix>.
shadowIconUrl: url of a icon to use for the shadow of the resource icon.
shadowIconWidth/shadowIconHeight: the size of the shadow icon in pixels.
crossSite: For each cross site test specified, a button will be displayed under the map to toggle status lines on and off the map. Each test has a name and a regex (regular expression to match the cross site test nicknames).
sites: The information about where to place resources in a site. Can have multiple logos and resources for a site. The logo angle/logoAnchorX/logoAnchorY are placement relative to the latitude/longitude. Angle is the degrees from the site center (latitude/longitude). For example, an angle of 0 will place the logo to the right of the resources, 180 to the left, 90 to the top, and 270 to the bottom. logoAnchorX and logoAnchorY are used to indicate the coordinates relative to the image that should be placed on the map. For example, if your image is 12x12, using logoAnchorX=6 and logoAnchorY=6 will place the image in the center.
debug: For development purposes. Will print out some log messages in a javascript window if greater than 0.
6.1.2.3. Accessing the Google Map View
Once setup is complete, load the map view by selecting the "Map of sampleSuite results" item of the CURRENT DATA menu in the navigation bar.
In the default installation, this links to http://localhost:8080/inca/jsp/status.jsp?xsl=google.xsl&xml=google.xml&suiteNames=sampleSuite&resourceIds=defaultGrid. This shows one resource and the Inca logo, similar to the map below. The resource status for multiple suites can be shown by editing header.xsl to provide comma-delimited lists for status.jsp's suiteNames and resourceIds parameters.
Clicking on the resource marker will display an info box as below. Clicking on the name of any failed test will take you to the reporter details page.
6.2. Reports
The items in the REPORTS menu display graphic reports of current Inca data and series histories. These graphs are generated using Cewolf, a JSP tag library for graphing based on JFreeChart. Some reports require the "incaQueryStatus" query to have run previously; information about queries can be found in Section 6.3.3.
6.2.1. Pass/Fail Graphs and Error Messages
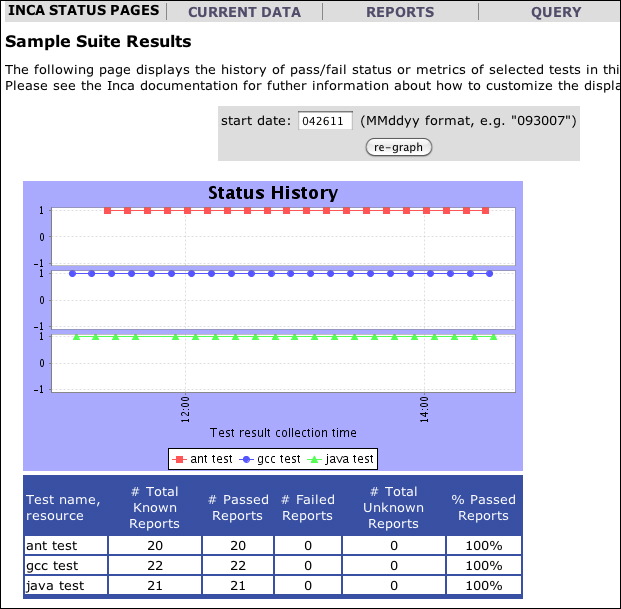
The first item in the REPORTS menu executes report.jsp, which uses CeWolf/JfreeChart, to generate historical summary reports with pass/fail status and error information.
The graphed series can be customized using the page described in Section 6.4.2. Each "graph" folder represents a separate graph on the page and the series under it will appear in the graph. Series should be entered in the format "nickname,resource,label" and correspond to the names and resources of committed series. Each graph has its own title. The height and width of all the graphs can also be customized as well as the page description and title.
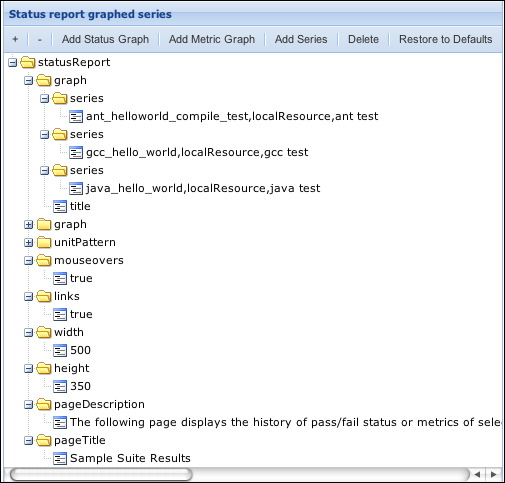
The default consumer groups different combinations of sampleSuite series and displays the past week of results. Each set of series has a title (e.g., Software Deployment Tests) for its grouping and the series nickname, resource name, and report label for each series in the group.
6.2.2. Metric Reports
Like above, the first item in the REPORTS menu executes report.jsp, which uses CeWolf/JfreeChart, to also generate historical summary reports graphing one or more metrics.
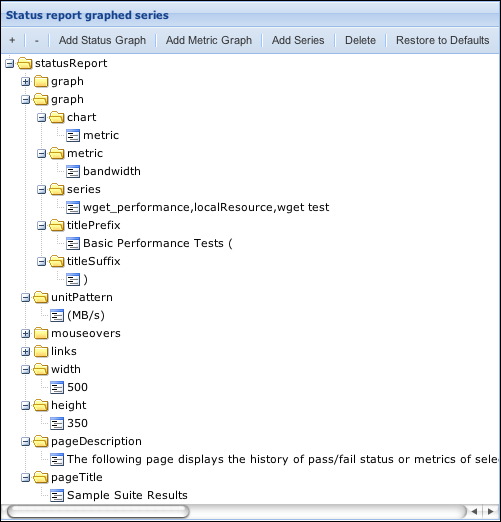
The graphed series can be customized using the page described in Section 6.4.2. Each "graph" folder represents a separate graph on the page and the series under it will appear in the graph. Series should be entered in the format "nickname,resource,label" and correspond to the names and resources of committed series. The default consumer graphs a single metric called 'bandwidth' for the series "wget_performance,localResource,wget test". Additional metrics can be specified as a comma separated list, e.g., "EP-STREAM_Triad_GB_s,G-STREAM_Triad_GB_s,Wall_Mins".
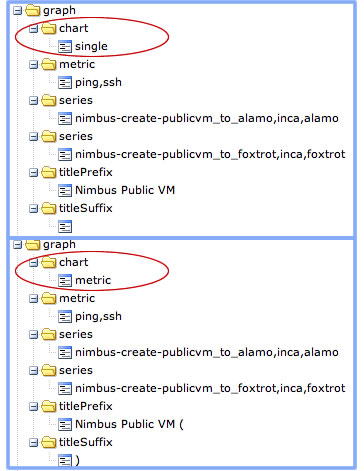
There are three different chart types that can be specified as defined below. By default, the chart type will be 'metric'.
metric: one graph containing all series will be printed per metric
series: one graph containing all metrics will be printed per series
single: all series and metrics will display on a single graph
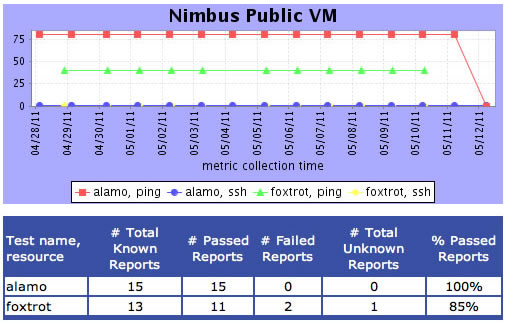
Below is the graph configuration for two series, one connecting to the alamo resource and the other to the foxtrot resource. Each series collects two metrics - ping and ssh. There are two graphs that are identically configured except that the first one uses the "single" chart type so that all series and metrics are graphed together, and the second uses the "metric" chart type so that the ssh and ping metrics are graphed separately.
The graphs created by the configuration above are shown below. The first graph uses the chart type "single" so we see four lines, one for each series and one for each metric:
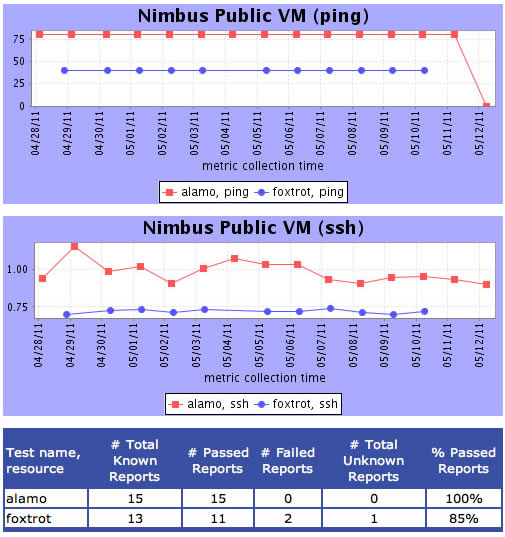
The second configuration uses the chart type "metric" so there are two graphs, one for each metric. Each graph has two lines, one for each series:
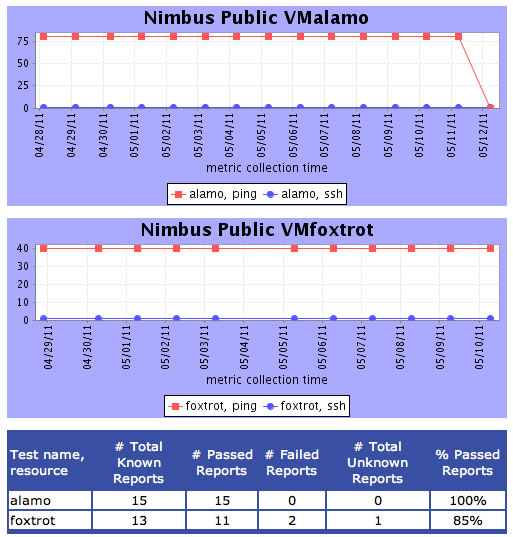
If configuration used the chart type "series" there would be two graphs, one for each series. Each graph would have two lines, one for each metric:
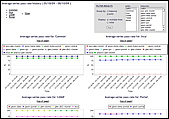
6.2.3. Average Pass Rate by Resource/Suite
The second item in the REPORTS menu executes summary.jsp, which uses CeWolf/JfreeChart and stylesheets seriesAverages.xsl and periodAverages.xsl to show the average series pass rate by resource and suite for the past week. Each bar label shows the value of the average series pass rate for the last week and the difference in percentage from the previous week. The color is green if the average pass rate is better than the previous week, red if the average pass rate is worse, and gray if there was no change. Individual bars can be clicked on to show the percentages broken down further for each individual resource or suite.
Click on any bar to view a more detailed report for that resource or suite. For example, clicking on the bar for the 'app-support.teragrid.org-4.0.0' suite above shows the average pass rates for the 'app-support.teragrid.org-4.0.0' suite for each resource (figure below).
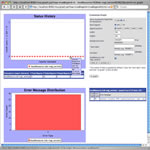
6.2.4. Series Error Summary
The third item in the REPORTS menu executes status.jsp with seriesSummary.xsl to summarize test series errors by time period. Each time period includes the number of errors for the series during the time period, the number of unique or distinct errors during the period, and the percentage of the total results that passed during the period.
The time periods and titles (i.e., PAST 4 WEEKS) can be customized using the page described in Section 6.4.2.
The change between the total number of errors in the most recent period and the total number of errors in the period before it is also given. If the number of errors in the most recent period is greater than the number of errors in the previous period (+), the number appears in red. If the number of errors in the most recent period is less than the number in the previous period (-), the number is green.
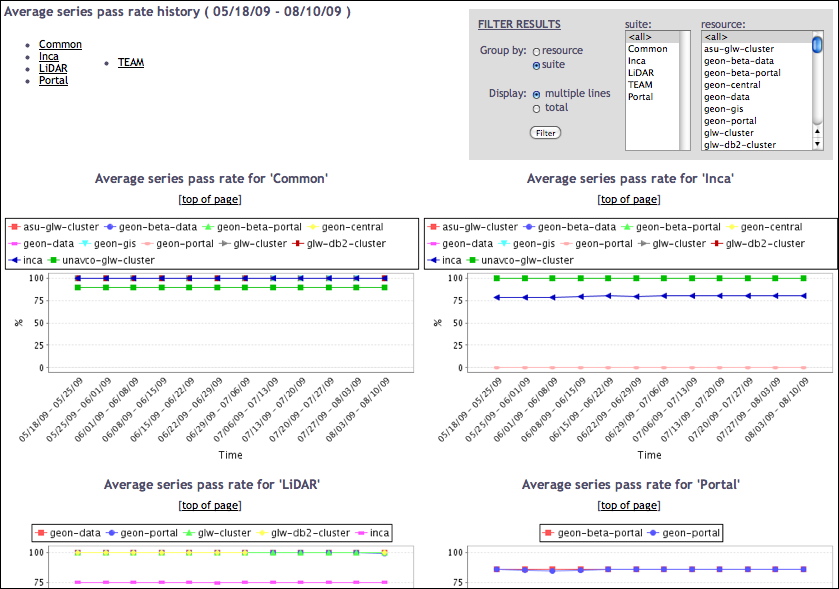
6.2.5. Average Pass History
The fourth and fifth items in the REPORTS menu execute summaryHistory.jsp, which uses CeWolf/JfreeChart and stylesheets seriesAverages.xsl and periodAverages.xsl to show the average series pass rate over time grouped by resource and suite. I.e., When grouped by suite, a history graph summarizing the average series pass rate is displayed for each suite. By default, multiple lines are used to show the summary history on each resource. To view the total summary history percentages for all resources, click the total checkbox in the top right corner and click the 'Filter' button. Histories for either specific resources or suites can also be displayed thru the form in the top right corner. The amount of history shown is 4 weeks by default but can be modified by editing the 'incaQueryStatus' query parameters described in Section 6.3.3.
6.3. Query
The query pages allow users to generate graphs and cache queries to improve data display.
6.3.1. Create Graph
The first item of the QUERY menu executes status.jsp with graph.xsl to create a form that allows you to graph the history of more than one series. The form allows you select the set of series of interest via a set of checkboxes.
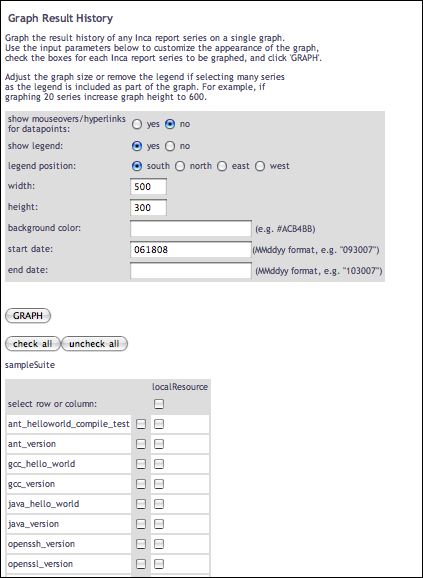
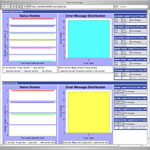
After selecting the "vtk-nvgl_version" series and clicking on the "graph" button in the form above, a graph page similar to the one below is shown with an XY plot of the pass/fail status of the selected series, a series pass/fail summary table, a bar graph of error message frequency (if the selected series have errors), a summary table of error messages, and a form to customize the graph further.
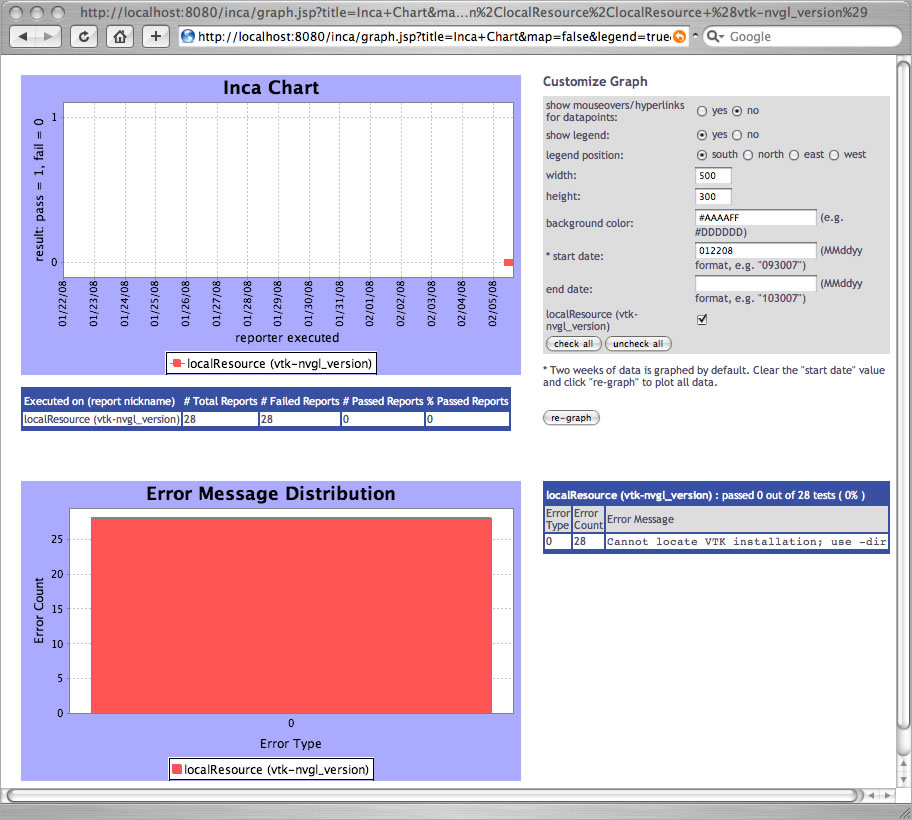
To query for all results, clear the "start date" field in the "customize graph" section and click "re-graph". To retrieve graphs more quickly, data point mouseover text and links to report details are turned off for the pass/fail graph. The data points can be made interactive by choosing "show mouseovers/hyperlinks" in the "customize graph" section and clicking on "re-graph". Clicking on interactive data points will lead to report details pages, mousing over them will show collection times and any error messages.

Multiple series can also be graphed together as in the image below. A table under each graph summarizes results for each series.
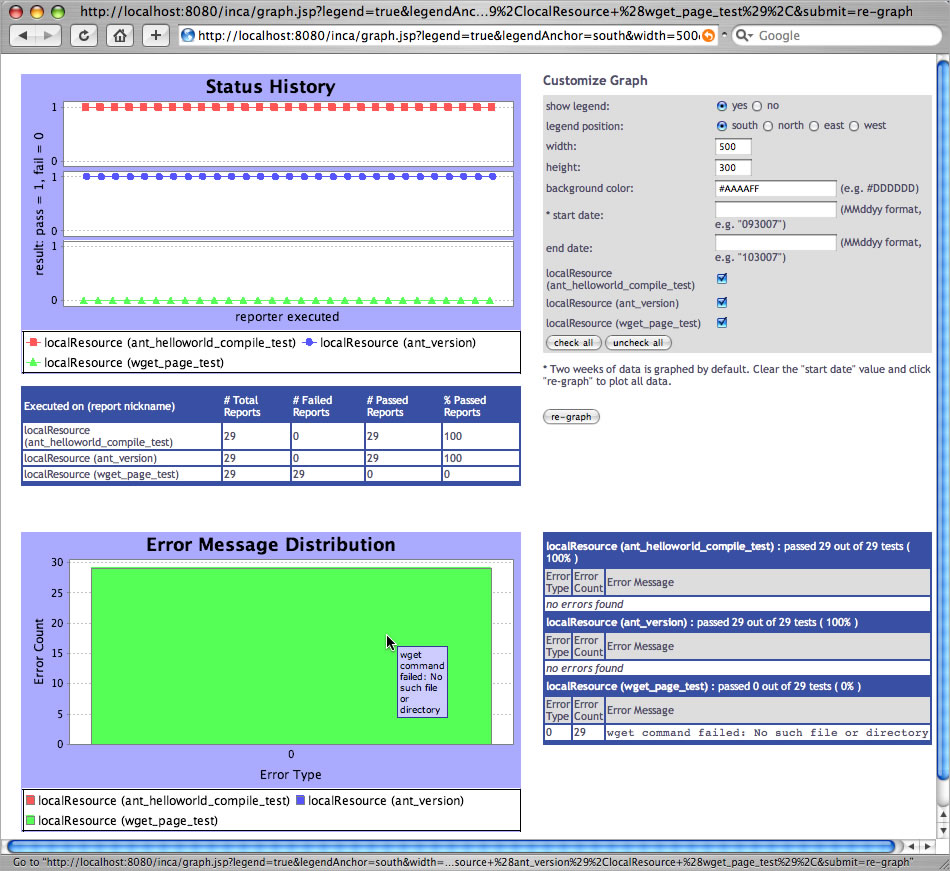
Graph pages for individual series are also linked from the report details pages.
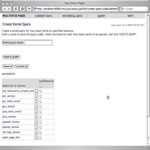
6.3.2. Create Stored Query
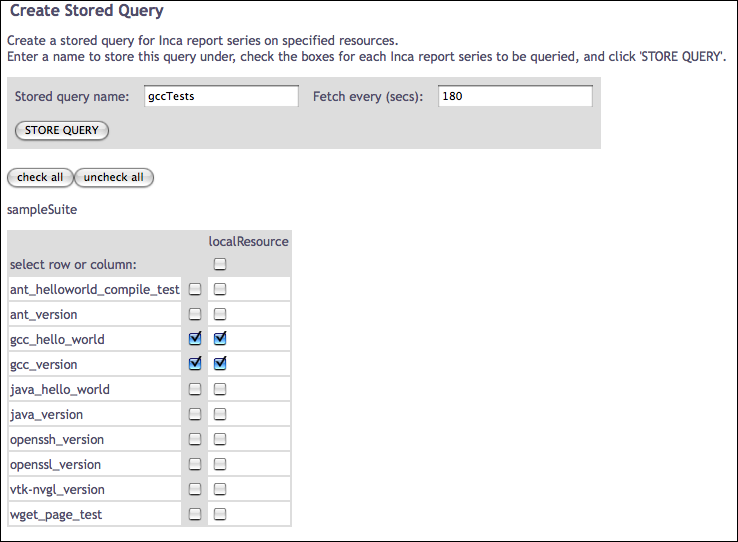
The second item in the QUERY menu executes status.jsp with create-query.xsl to provide a form for creating a cached query. Unless password protection has been disabled as described in Section 6.15, selecting this item causes the consumer to prompt for an id and password. The consumer can cache frequently executed depot queries in order to improve data display speed. For example, the latest results for a suite can be cached in order to quickly display a suite status page. By default the latest results for the sampleSuite are cached every 2 minutes. Results are also cached each day for historical reports.
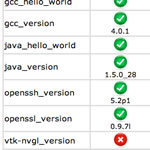
Cached queries can be used to display custom tables of latest results, using the queryNames parameter to status.jsp For example, the image below shows the creation of a cached query, named gccTests, for two series in the default installation.
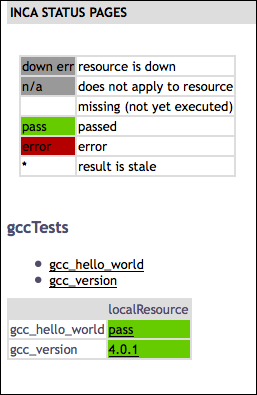
Once this query has been stored and executed, the table shown below can be viewed via http://localhost:8080/inca/jsp/status.jsp?queryNames=gccTests&resourceIds=defaultGrid
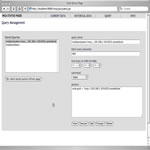
6.3.3. Manage Stored Queries
The third item in the QUERY menu executes query.jsp to allow management of cached queries. Unless password protection has been disabled as described in Section 6.15, selecting this item causes the consumer to prompt for an id and password. Click on one of the pre-defined queries to see its parameters. Each query has a name, execution schedule, depot command it executes and the parameters for the depot command executed.
By default, the latest instances of all suites are cached every 2 minutes by predefined queries named incaQueryLatest+agentUri_suiteName. These cached queries are used for the CURRENT DATA menu views described in Section 6.1. Another default query is "incaQueryStatus" which retrieves a summary of the number of successes and failures for each series for the past 4 weeks. This cached query is used for the several of the reports described in Section 6.2. To display 10 weeks of history instead, modify "28" days to "70" and click "Change". Note that the consumer will automatically re-create any of these default queries that are deleted.
6.4. Admin
The ADMIN menu item offers two views of the running reporters in an Inca deployment and a configuration page. To link other informational pages under this heading, customize the header.xsl file as described in Section 6.9.3.
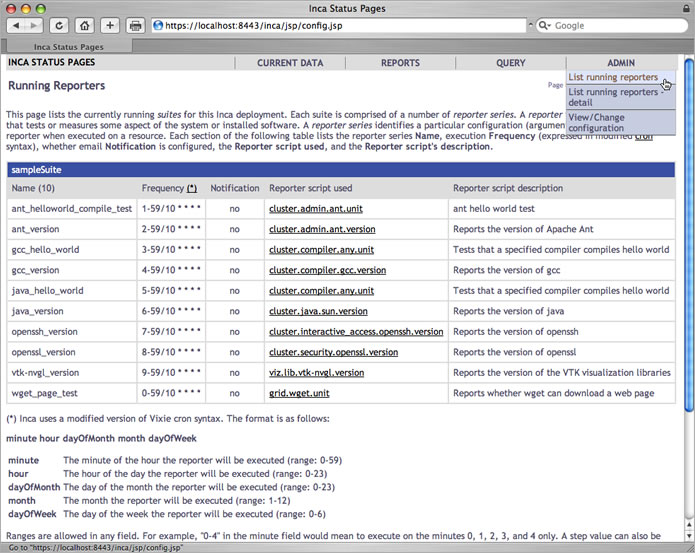
6.4.1. List Running Reporters
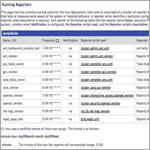
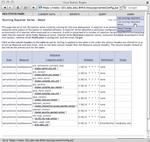
The "Running Reporters" page displays running reporters series by suite. Each series lists its name, frequency of execution, whether email notification is enabled, the reporter script used for the series, and a description of the reporter script. Note that in this view, and in the more detailed running reporters view, the reporter names link to a CGI script that will not work for repositories that are not web accessible (like the local default repository). Make your repository web accessible and add/commit the repository URL beginning with "http" in order to activate the reporter links.
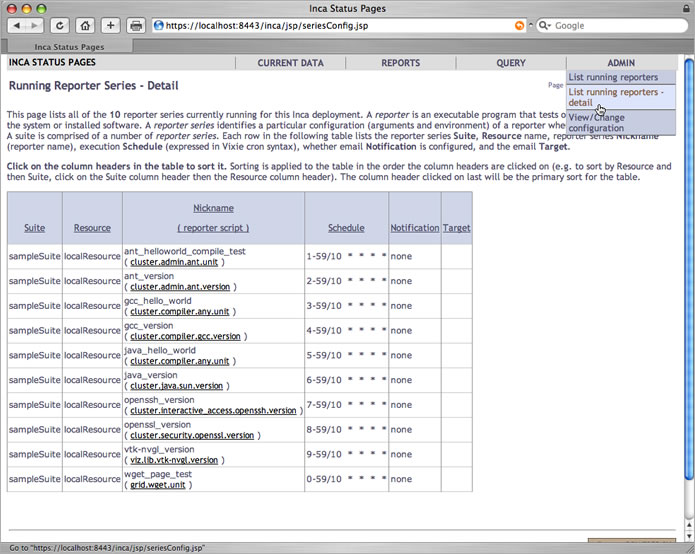
The detailed "Running Reporter Series" page below lists the running reporter series and the suite each belongs to, the machine each is scheduled to execute on, whether email notification is configured, and the recipient ("Target") of any notification.
6.4.2. View/Change Configuration
Here Inca administrators can view and change the global configuration of status pages. Determine whether to allow run nows or the execution of tests via the detailed status pages (see Section 6.5.1) and configure the knowledge base, google map, series summary and status report status pages.
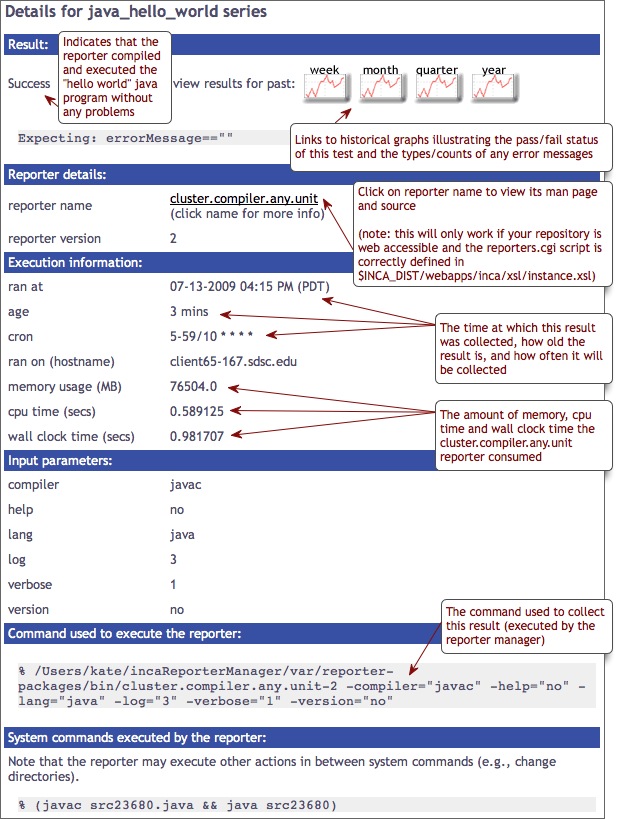
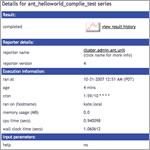
6.5. Report Details
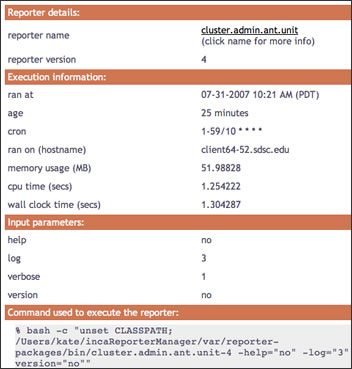
The Current Data, Reports, and Query views described in previous sections provide links to a view that displays the individual report details as shown in the figure below.
6.5.1. Run Nows
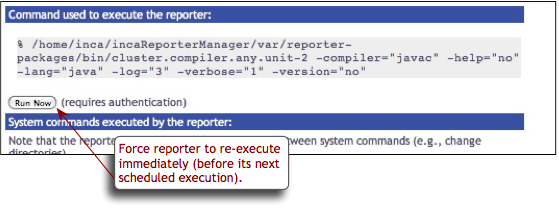
If the "Allow run nows from web pages" option is checked (see Section 6.4.2), a "Run Now" button will appear under the "Command used to execute the reporter" heading. This option is useful for system administrators who have fixed an issue and want to see the updated result or for those who want to verify that a problem has been resolved.
Clicking on the "Run Now" button triggers reporter execution on the local machine. Depending on the reporter execution time and page cache frequency (see Section 6.3.3), results may take a few minutes to propagate to the Inca web pages.
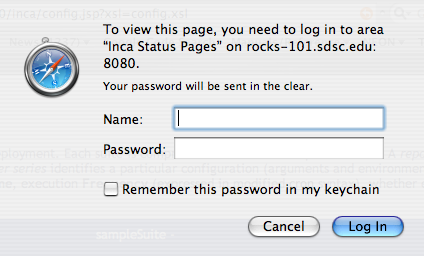
Since authentication is required based on the authentication setup (see Section 6.15), a box will popup such as follows:
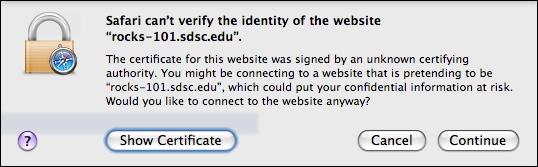
Press 'Continue' and the security login window will display such as follows:
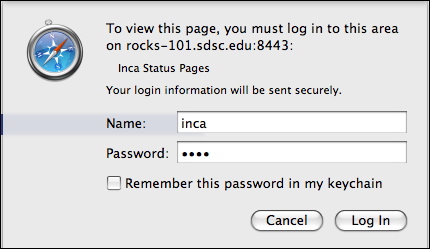
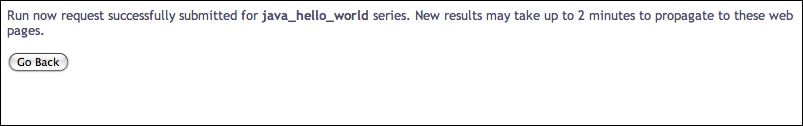
Use the username and password specified in $INCA_DIST/etc/realm.properties. By default, the username and password are 'inca'. After the consumer submits the request, you will see a confirmation such as below:
6.5.2. Knowledge Base
The Inca default knowledge base is designed to collect problem resolution information for tests. System administrators may use solutions stored in the knowledge base when debugging issues on their resources. The knowledge base can be configured using the admin page described in Section 6.4.2 with the options described after the configuration image below:
enable:
If the "enable" value is set to "true" then a "search knowledge base" button and an "add to knowledge base" button will appear under the "Result" heading of the reporter details status pages. If "enable" is set to "false" then the knowledge base buttons will be hidden and inaccessible.
searchString:
The URL that will be visited after clicking on the "search knowledge base" button. The macros "@nickname@", "@reporter@" and "@error@" will be replaced by the actual series nickname (e.g. gcc_version), reporter name (e.g. cluster.compiler.gcc.version), and error message for each test. The "+" character will be replaced by "&".
submitString:
The URL that will be visited after clicking on the "add to knowledge base" button. The macros "@nickname@", "@reporter@" and "@error@" will be replaced by the actual series nickname (e.g. gcc_version), reporter name (e.g. cluster.compiler.gcc.version), and error message for each test. The "+" character will be replaced by "&".
submitEmailNotification:
The email address to send new, changed, and removed knowledge base articles to. By default no email notifications are sent and the "submitEmailNotifications" value is set to "none". To add email notifications, change this value to an email address or a list of email addresses separated by commas (e.g. "email1@loc.edu, email2@loc.edu").
Once the knowledge base is enabled, two buttons to search and add to the knowledge base will appear on the report details pages:
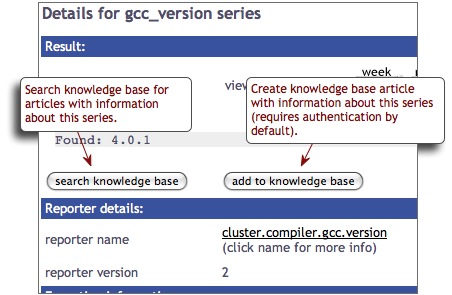
Clicking on the "search knowledge base" button will lead to the URL set as the "searchString" value. By default, this returns all of the knowledge base articles related to the series:
Clicking on the "add to knowledge base" button will lead to the URL set as the "submitString" value. By default, this is a form for entering article information. Since authentication is required for this form based on the authentication setup (see Section 6.15), a box will popup such as follows:
Press 'Continue' and the security login window will display such as follows:
Use the username and password specified in $INCA_DIST/etc/realm.properties. By default, the username and password are 'inca'. After the consumer submits the request, a form will appear to complete like the one below:
6.5.2.1. Using an External or Custom Knowledge Base
To use an external or custom knowledge base instead of Inca's default internal knowledge base, configure the "searchString" and "submitString" parameters described in Section 6.5.2. For example, to add articles to an external knowledge base with a cgi submission form like
https://www.teragrid.org/cgi-bin/add-kb.cgi?articleText=text
change the "submitString" parameter to something like
https://www.teragrid.org/cgi-bin/add-kb.cgi?articleText=@nickname@%20@error@
Inca will replace the @nickname@ macro with the actual series nickname (e.g. gcc_version) and the @error@ macro with the series error message. The "%20" represents a space since Inca replaces the "+" character with "&". Therefore, if the external knowledge base had a cgi submission form like
https://www.teragrid.org/cgi-bin/add-kb.cgi?articleTitle=title&articleText=text
then the "submitString" parameter would be changed to something like
https://www.teragrid.org/cgi-bin/add-kb.cgi?articleTitle=@nickname@+articleText=@error@
The same syntax applies to the "searchString" parameter, which Inca uses to search for knowledge article and can be an external or custom URL.
6.6. Report Summaries
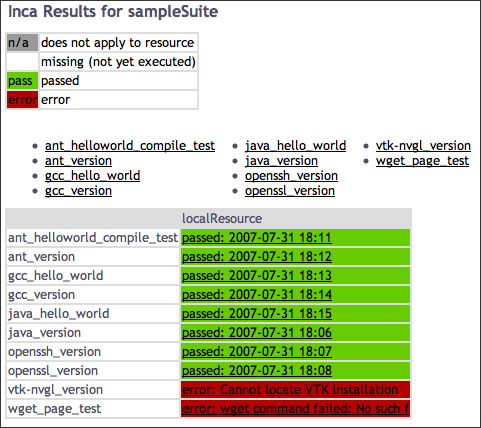
The Current Data and Query views described in previous sections display "latest" report summaries like the one shown in the figure below.
Report summaries are generated by a depot query that returns the XML described in Section 7.1.1.
6.7. Description of Data Consumer Files
The following table describes the main JSPs contained in the default consumer. The JSPs generally retrieve XML from depot and agent functions and apply XSL stylesheets to display HTML. If the "debug=1" parameter for a JSP is used, the JSP displays the XML. Parameters marked with an asterisk (*) are optional.
Table 2. Default Consumer JSP
Name | Purpose | Parameters | |
|---|---|---|---|
config.jsp
| Prints description of deployed suites and series. Linked at the bottom of index.jsp |
| |
error.jsp
| Prints Inca error message page. |
| |
graph.jsp
| Historical graphs of pass/fail status and error frequency. |
e.g. http://localhost:8080/inca/jsp/graph.jsp?series=ant_helloworld_compile_test,localResource | |
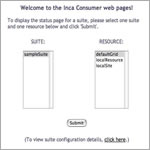
index.jsp
| Lists an installation's configured suites and resource names in an HTML form whose action is to display results for the selected suite and resource. The consumer initially redirects to this page. |
| |
instance.jsp
| Queries depot for report instance and invokes the specified xsl stylesheet on it. |
| |
query.jsp
| Page for managing stored queries in the Consumer. Queries can be added, deleted, changed, viewed or executed (and return XML). This jsp page manages the query manipulation via jsp tags and leaves the display of the current queries to a stylesheet. |
| |
report.jsp
| Summary report with graphs of pass/fail status and error frequency. |
| |
seriesConfig.jsp
| Prints detailed (expanded) information about running reporter series. Linked in ADMIN menu. |
| |
status.jsp
| Displays current results for a set of suites or cached queries. This page is the action of the index.jsp form to display suite results. |
e.g. http://localhost:8080/inca/jsp/status.jsp?suiteNames=sampleSuite&resourceIds=defaultGrid | |
summary.jsp
| Shows the average series pass rate by resource and by suite for a given time period. Uses seriesAverages.xsl and periodAverages.xsl to calculate statistics. | ||
summaryDetails.jsp
| Displays summary statistic details for resource or suite. Linked from summary.jsp. Uses seriesAverages.xsl and periodAverages.xsl to calculate statistics. |
e.g. http://localhost:8080/inca/jsp/summaryDetails.jsp?resource=localResource | |
summaryHistory.jsp
| Displays average series pass rate by resource or suite. Uses seriesAverages.xsl and periodAverages.xsl to calculate statistics. |
e.g. http://localhost:8080/inca/jsp/summaryHistory.jsp?groupBy=resource |
The default JSPs use the XSL stylesheets in $INCA_DIST/webapps/xsl to transform the XML into HTML. The following stylesheets are installed with the default consumer:
Table 3. Default Consumer XSL
Name | Applied To | Purpose |
|---|---|---|
config.xsl
| config.jsp | Prints description of deployed suites and series. |
create-query.xsl
| status.jsp | Prints form to select series and resources to query. |
default.xsl
| status.jsp | Prints table of suite(s) results. |
error.xsl
| error.jsp | Displays JSP error message and usage information. |
footer.xsl
| (included in most other xsl files) | Prints HTML page footer with the Inca logo. |
google.xsl
| status.jsp | Prints google map summary of current data. |
graph.xsl
| status.jsp | Prints form to select series to graph. |
header.xsl
| (included in most other xsl files) | Prints HTML page header. |
inca-common.xsl | (included in most other stylesheets) | Common templates for use in Inca stylesheets. |
index.xsl
| index.jsp | Lists all configured suite and resource names in an HTML form whose action is to display results for the selected suite and resource. |
instance.xsl
| instance.jsp | Prints HTML table with report details. |
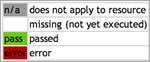
legend.xsl
| (included in default.xsl and swStack.xsl) | Prints a key to cell colors and text. |
periodAverages.xsl
| summary.jsp, summaryDetails.jsp, summaryHistory.jsp | Computes pass percentage for suites and resources for a given period. |
query.xsl
| query.jsp | Creates form to manipulate hql queries. |
seriesAverages.xsl
| summary.jsp, summaryDetails.jsp, summaryHistory.jsp | Computes series pass percentages. |
seriesSummary.xsl
| status.jsp | Print out a table of stats for individual series. |
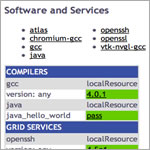
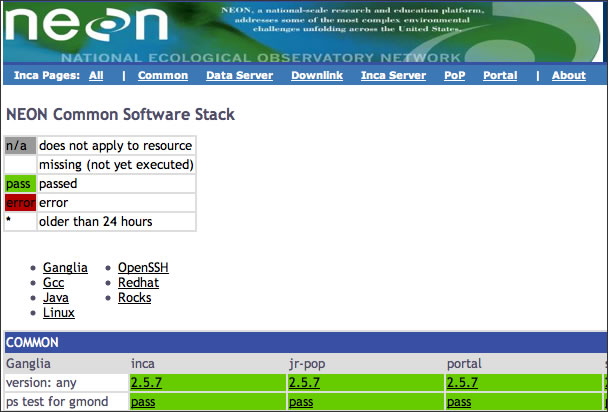
swStack.xsl
| status.jsp | Prints table of suite(s) results. Uses XML file to format table rows by software categories and packages. |


6.8. REST URLs
Inca provides the ability to fetch suite or stored query data in XML or HTML format using REST URLs. By default, the consumer recognizes a REST URL using the following format:
http://localhost:8080/inca/XML|HTML/rest/<suiteName>|<queryName>[/<resourceId>[/<seriesNickname>[/<timestamp>|week|month|quarter|year]]]
Table 4. Examples of Inca REST URLs
REST URL (Equivalent URL shown under REST URL) | Returns |
|---|---|
http://localhost:8080/inca/HTML/rest/sampleSuite equivalent to: http://localhost:8080/inca/jsp/status.jsp?suiteNames=sampleSuite | An HTML table of latest results for the specified suite (or query). Generated by applying an XSL stylesheet to an array of report summaries.
|
http://localhost:8080/inca/HTML/rest/sampleSuite/defaultGrid equivalent to: http://localhost:8080/inca/jsp/status.jsp?suiteNames=sampleSuite&resourceIds=defaultGrid | An HTML table of latest results for the specified suite and resource. Generated by applying an XSL stylesheet to an array of report summaries.
|
http://localhost:8080/inca/HTML/rest/sampleSuite/localResource/ant_version equivalent to: http://localhost:8080/inca/jsp/instance.jsp?nickname=ant_version&resource=localResource&collected=2010-06-14T12:52:00.000-07:00 (collected param would vary) | An HTML table of the *latest* report details for the specified suite, resource and series.
|
equivalent to: | An HTML table of the report details for the specified suite, resource, series and timestamp.
|
http://localhost:8080/inca/HTML/rest/sampleSuite/localResource/ant_version/week equivalent to: http://localhost:8080/inca/jsp/graph.jsp?series=ant_helloworld_compile_test,localResource&startDate=060710 (startDate param would vary) | Graph of weekly historical results the specified suite, resource and series (also available for month, quarter or year). Generated by graphing an array of graph instances.
|
If you want to fetch the data in XML, just replace HTML as below:
http://localhost:8080/inca/XML/rest/sampleSuite/localResource
If you would like to change the id 'rest' to a more transparent id such as 'kit-status-v1', edit <context-param> in $INCA_DIST/webapps/inca/WEB-INF/web.xml and restart the consumer. For example, change
      <context-param>
        <param-name>restId</param-name>
        <param-value>rest</param-value>
      </context-param>
|
to
      <context-param>
        <param-name>restId</param-name>
        <param-value>kit-status-v1</param-value>
      </context-param>
|
6.9. Changing the Look
6.9.1. Colors and Fonts
Properties such as colors and fonts are controlled by the default CSS (Cascading Style Sheet) file $INCA_DIST/webapps/inca/css/inca.css. The drop down nav bar in the header is controlled by $INCA_DIST/webapps/inca/css/nav.css. You can edit these files to customize the consumer display. For example, to change the color in the reporter detail pages header bar, edit inca.css and change lines 111-112 to:
.header {
background-color: #D07651; |
For general information, visit the [ CSS tutorial ].
6.9.2. HTML Layout
To modify the default HTML layout, edit the XSL stylesheet that is being applied to the JSP or create a new stylesheet in $INCA_DIST/webapps/inca/xsl and pass it in the JSP "xsl" parameter. The default JSP and XSL files are described in Section 6.7.
For general information about editing stylesheets, visit the [ XSL tutorial ].
6.9.2.1. Custom Values in HTML Table Cells
To display report values other than the default text of either a software version, "pass", or "error" on the suite results pages, edit default.xsl.
For example, to change the default suite status to print the time successful reporters ran and a truncated error message for failures like:
Edit default.xsl, add a new variable for the custom table cell text and print the custom cell text rather than the default text:
188 <xsl:variable name="cellText">
189 <xsl:choose>
190 <xsl:when test="string($instance)=''">
191 <xsl:value-of select="''" />
192 </xsl:when>
193 <xsl:when test="string($result/body)!=''
194 and string($result/errorMessage)=''
195 and ($comparitor='Success' or count($comparitor)=0)">
196 passed:�
197 <!-- get yyyy-mm-dd from gmt timestamp -->
198 <xsl:value-of select="substring($result/gmt, 1, 10)" />�
199 <!-- get HH:MM from gmt timestamp -->
200 <xsl:value-of select="substring($result/gmt, 12, 5)" />
201 </xsl:when>
202 <xsl:otherwise>
203 error:
204 <xsl:value-of select="substring($result/errorMessage, 1, 30)" />
205 </xsl:otherwise>
206 </xsl:choose>
207 </xsl:variable>
208 <xsl:choose>
209 <xsl:when test="$exit!=''">
210 <td class="{$exit}">
211 <a href="{$href}"><xsl:value-of select="$cellText"/></a>
212 <xsl:if test="$url[matches(., 'markOld')]"> |
6.9.3. Custom Page Header
The default page header is generated by the inclusion of the header.xsl file in other xsl files. The header is a navigation bar with drop down links to a set of default status pages:
The header's navigation bar is an HTML unordered list that is formatted with the nav.css stylesheet. To add or remove links in the navigation bar, open header.xsl and change the appropriate link. For example, to show a table of suite results for a new suite called "newSuite" on a new resource called "newResource":
57 <li><h2>Current Data</h2> 58 <ul> 59 <li> 60 <a href="'status.jsp?xsl=default.xsl&suiteNames=newSuite&resourceIds=newResource'"> 61 table of newSuite results</a> 62 </li> |
Any other link can be added or removed as a list element. The stylesheet supports additional levels of nested list links. Note that the top level list elements are displayed from bottom to top (i.e., CURRENT DATA is listed last in header.xsl so it is displayed the furthest left in the top level navigation bar).
Another example of customizing the HTML header would be to add a call to a custom header stylesheet in the "printBodyTitle" template. Edit inca-common.xsl:
13  <xsl:include href="custom-header.xsl"/>
          ...
          24  <xsl:template name="printBodyTitle">
          25    <xsl:param name="title"/>
          26    <xsl:call-template name="custom-header"/>
          27    <xsl:variable name="datenow" select="date:new()" />
          28    <xsl:variable name="dateformat" select="sdf:new('MM-dd-yyyy hh:mm a (z)')"/>
          29    <table width="100%" border="0">
30 <tr align="left"> |
Create a $INCA_DIST/webapps/xsl/custom-header.xsl like:
<?xml version="1.0" encoding="UTF-8"?>

          <!-- ================================================ -->
          <!-- Prints out custom header for Inca status pages   -->
          <!-- ================================================ -->
          <xsl:stylesheet version="1.0"
          xmlns:xsl="http://www.w3.org/1999/XSL/Transform"
          xmlns="http://www.w3.org/1999/xhtml">

          <xsl:template name="custom-header">
          <table class="header" width="100%">
          <tr>
          <td bgcolor="#003366">
          <img class="logo" src="img/header.jpg"/>
          </td>
          </tr>
          </table>
          <table class="menu" width="100%">
          ... custom navigation ...
          </table>
          </xsl:template>

</xsl:stylesheet> |
The resulting page would look something like:
6.10. Displaying Errors Neutrally
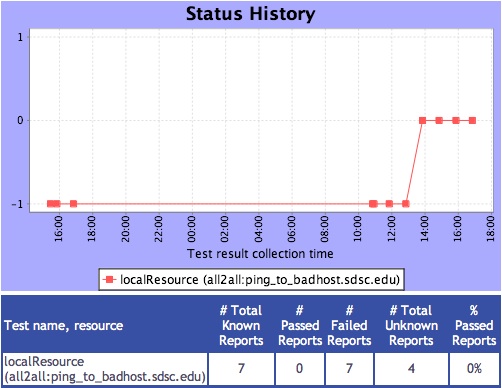
You may wish to display certain errors neutrally in historical reports. For example, if an error message indicates that a machine was down when the report was collected, you may want to display that error neutrally (i.e. neither as a pass nor a fail). By default, Inca marks error messages that start with "DOWNTIME" or "NOT_AT_FAULT" neutrally because they are generally the result of report filtering (see Section 11.3). Errors that contain "Inca error" or "Unable to fetch proxy for reporter execution" are also marked neutrally since the error may be due to the Inca framework instead of the machine being tested. To change the errors that are marked neutrally, edit the regular expression that is matched as follows:
Open the $INCA_DIST/etc/common/inca.properties local file and edit the inca.consumer.ignoreErrors property:
inca.consumer.ignoreErrors=(^DOWNTIME:.*|^NOT_AT_FAULT.*|.*Inca error.*|.*Unable to fetch proxy for reporter execution.*)
Restart the consumer:
% cd $INCA_DIST; ./bin/inca restart consumer
Now error messages matching the pattern you chose will be marked neutrally. For example, the four reports that have error messages that begin with "NOT_AT_FAULT" are marked neutrally as "unknown" in the graph below:
6.11. Changing the Installation Location
You can install the data consumer in a non-default location (e.g., on a machine where the depot and agent are not running) if you:
Copy the incaInstall.sh script to the machine where the consumer will run.
% wget http://inca.sdsc.edu/releases/2.6/incaInstall.sh
Install consumer on the new machine:
% ./incaInstall.sh $INCA_DIST consumers
Copy the consumer key, certificate, and trusted directory from the machine where the agent/depot are running (orig.machine) to the new machine:
% scp orig.machine:$ORIG_INCA_DIST/etc/consumerkey.pem $INCA_DIST/etc/; \
          scp orig.machine:$ORIG_INCA_DIST/etc/consumercert.pem $INCA_DIST/etc/;
          scp "orig.machine:$ORIG_INCA_DIST/etc/trusted/*" $INCA_DIST/etc/trusted/;
Edit the $INCA_DIST/etc/common/inca.properties local file and specify the full hostname of the machine where the agent and depot are running:
114 inca.consumer.agent=incas://agent.hostname:6323
            ...
            128 inca.consumer.depot=incas://depot.hostname:6324
Start the consumer component on the new machine:
% cd $INCA_DIST; ./bin/inca start consumer
6.12. Changing Ports
By default, the consumer is started on port 8080 (HTTP) and 8443 (HTTPS). To change the port numbers, edit $INCA_DIST/etc/jetty.xml. For example to change the HTTP port to 9080, search for 'SelectChannelConnector' and change the following line:
<Set name="port">8080</Set>
|
to:
<Set name="port">9080</Set>
|
Likewise to change the HTTPS port to 9443, search for 'SslSocketConnector' and change the following line:
<Set name="port">8443</Set>
|
to:
<Set name="port">9443</Set>
|
If you also have the HTTP port enabled, change the confidentialPort tag under its configuration from:
<Set name="confidentialPort">8443</Set>
|
to:
<Set name="confidentialPort">9443</Set>
|
6.13. Disabling HTTP
By default, the consumer is configured as both an HTTP and HTTPS server. To disable HTTP, edit $INCA_DIST/etc/jetty.xml and comment out the section "Add a HTTP listener on port 8080"
      <!-- - - - - - - - - - - - - - - - - - - - - - - - - - - - - - - - - -->
      <!-- Add a HTTP listener on port 8080                                -->
      <!-- - - - - - - - - - - - - - - - - - - - - - - - - - - - - - - - - -->
      <!--
      <Call name="addConnector">
        <Arg>
            <New class="org.mortbay.jetty.nio.SelectChannelConnector">
              <Set name="host"><SystemProperty name="jetty.host" /></Set>
              <Set name="port"><SystemProperty name="jetty.port" default="8080"/></Set>
              <Set name="maxIdleTime">30000</Set>
              <Set name="Acceptors">2</Set>
              <Set name="statsOn">false</Set>
              <Set name="confidentialPort">8443</Set>
        <Set name="lowResourcesConnections">5000</Set>
        <Set name="lowResourcesMaxIdleTime">5000</Set>
            </New>
        </Arg>
      </Call>
      -->
|
Then restart the consumer.
% ./bin/inca restart consumer
|
6.14. Changing HTTPS credential
By default, the HTTPS server will use the credential stored in $INCA_DIST/etc/consumerKeystore. Its DN is "cn=Inca Consumer SSL, o=SDSC, l=San Diego, st=California, c=US". If you'd like to generate a certificate with a different DN, run the keytool command as follows:
% rm -f etc/consumerKeystore
% keytool -keystore etc/consumerKeystore -alias jetty -genkey -keyalg RSA -dname your_DN
|
keytool will prompt you for a keystore password and a key password. You can either make them different or use the same one. If you use the password "consumer", no further changes are needed. Otherwise, you will have to modify <Set name="keyPassword">, <Set name="password">, and <Set name="trustPassword"> in the "Add a HTTPS SSL listener on port 8443" section in $INCA_DIST/etc/jetty.xml. You can either put the password in there in plain text or obfuscate it using Jetty's password utility as follows:
% java -classpath lib/jetty-6.1.7.jar:lib/jetty-util-6.1.7.jar org.mortbay.jetty.security.Password your_password
|
It will output two lines such as follows:
    OBF:1t3b1uh61ugk1t2v
    MD5:482b9f833150f58964b78ddbfa5ab23d
|
Edit $INCA_DIST/etc/jetty.xml and replace the string beginning with OBF in both <Set name="KeyPassword"> and <Set name="Password"> with the string provided by Jetty's password utility:
      <Set name="password">OBF:1v8w1v2h1wg01z0d1z0h1wfy1v1x1v9q</Set>
      <Set name="keyPassword">OBF:1v8w1v2h1wg01z0d1z0h1wfy1v1x1v9q</Set>
      <Set name="trustPassword">OBF:1v8w1v2h1wg01z0d1z0h1wfy1v1x1v9q</Set>
|
6.15. Adding Password Protection
By default, a password is only required on the query.jsp and status-auth.jsp pages. To expand or remove password protection, edit the section 'require authentication on specific status pages' in $INCA_DIST/webapps/inca/WEB-INF/web.xml.
    <security-constraint>
      <web-resource-collection>
        <web-resource-name>Inca Status Pages</web-resource-name>
        <url-pattern>/jsp/admin.jsp</url-pattern>
        <url-pattern>/jsp/query.jsp</url-pattern>
        <url-pattern>/jsp/runNow.jsp</url-pattern>
        <url-pattern>/jsp/status-auth.jsp</url-pattern>
      </web-resource-collection>
      <auth-constraint>
        <role-name>*</role-name>
      </auth-constraint>
      <user-data-constraint>
        <transport-guarantee>CONFIDENTIAL</transport-guarantee>
      </user-data-constraint>
    </security-constraint>
|
Modify or add url-pattern tags to modify password access. For example to apply password access to all Inca status pages, modify the url-pattern tag to below:
        ...
        <url-pattern>/*</url-pattern>
        ...
|
Or to add password protection to another JSP page like config.jsp, add another url-pattern tag like below:
        ...
        <url-pattern>/jsp/query.jsp</url-pattern>
        <url-pattern>/jsp/config.jsp</url-pattern>
        ...
|
By default, the username and password for the pages will be "inca". To change this, edit $INCA_DIST/etc/realm.properties and customize the username and password for your installation. If you do not want to store the password in plain text, use Jetty's password utility described in Section 6.14.
Then restart the consumer.
% ./bin/inca restart consumer |
The next time you view the status pages, you should see a login like: