- Table of Contents
- 1. Introduction
- 2. Requirements
- 3. Recommendations
- 4. Quick Start
- 5. Administering Inca with incat
- 5.1. Repositories
- 5.2. Resource Configuration
- 5.3. Suites
- 5.4. Committing/Saving
- 5.5. Resource Access Methods
- 5.6. Requiring Resource Administrator Approval
- 5.7. Proxies
- 5.8. Suspend Execution
- 5.9. Using Resource Macros
- 5.10. Series Comparison and Notification
- 6. Data Display (Data Consumers)
- 6.1. Current Data
- 6.1.1. Tabular Suite Summary View
- 6.1.2. Map View using Google Map API
- 6.2. Reports
- 6.2.1. Pass/Fail Graphs and Error Messages
- 6.2.2. Metric Reports
- 6.2.3. Average Pass Rate by Resource/Suite
- 6.2.4. Series Error Summary
- 6.2.5. Average Pass History
- 6.3. Query
- 6.3.1. Create Graph
- 6.3.2. Create Stored Query
- 6.3.3. Manage Stored Queries
- 6.4. Admin
- 6.4.1. List Running Reporters
- 6.4.2. View/Change Configuration
- 6.5. Report Details
- 6.5.1. Run Nows
- 6.5.2. Knowledge Base
- 6.6. Report Summaries
- 6.7. Description of Data Consumer Files
- 6.8. REST URLs
- 6.9. Changing the Look
- 6.9.1. Colors and Fonts
- 6.9.2. HTML Layout
- 6.9.3. Custom Page Header
- 6.10. Displaying Errors Neutrally
- 6.11. Changing the Installation Location
- 6.12. Changing Ports
- 6.13. Disabling HTTP
- 6.14. Changing HTTPS credential
- 6.15. Adding Password Protection
- 7. Writing Custom Data Consumers
- 7.1. Understanding Inca XML Data
- 7.1.1. Report Summaries
- 7.1.2. Graph Instances
- 7.1.3. Report Details
- 7.2. Retrieving Data
- 7.2.1. REST APIs
- 7.2.2. Web Services API
- 7.2.3. Inca Client APIs
- 8. Reporters and Repositories
- 8.1. Executing Reporters
- 8.2. Writing Reporters
- 8.2.1. Reporter XML Schema
- 8.2.2. Reporter XML Output
- 8.2.3. Reporter APIs
- 8.2.4. Reporter Writing Tips
- 8.3. Reporter Repositories
- 9. Web Services
- 10. Security
- 11. Advanced Configuration
- 11.1. Inca Component Options
- 11.2. Customizing Series Notification
- 11.3. Report Filtering
- 11.3.1. Downtime Filter
- 11.3.2. All2All Filter
- 11.3.3. Multiple Filters
- 11.4. Depot Database Configuration
- 11.5. Depot Fault Tolerance
- 11.6. Manual Access Method
- 11.7. Batch Systems
- 11.8. Manual Run Now
- 11.9. Source Distributions
- 12. Component Man Pages
- 12.1. Depot
- 12.2. Agent
- 12.3. Reporter Manager
- 12.4. Consumer
- 12.5. Incat
- 12.6. Inca Web Services
- 13. Troubleshooting
- 13.1. Log Files
- 13.2. Authentication Problems
1. Introduction
Determining whether a Grid is up in the face of complex Grid software deployments can be difficult and depends on the types of applications and users that utilize it. By detailing a set of software, services, and features that should be available on a Grid in a machine-readable format, a Grid can be tested periodically by an automated system to verify its health and usability to users. To this end, we have developed Inca as a flexible framework to perform periodic, user-level functionality testing and performance measurement of Grid systems. It includes mechanisms to schedule the execution of information gathering scripts, and to collect, archive, publish, and display data
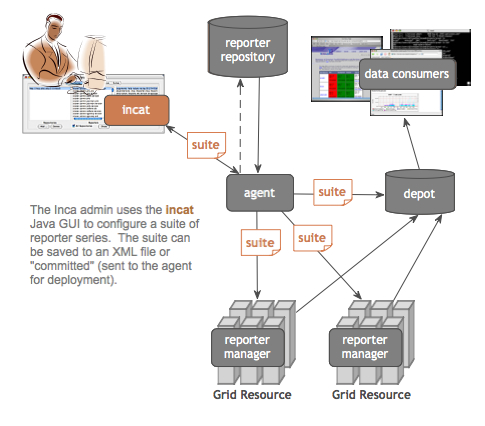
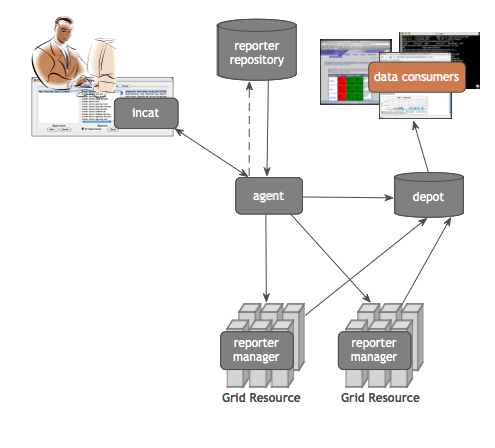
The architecture of Inca and a description of its components is shown in the below figures.
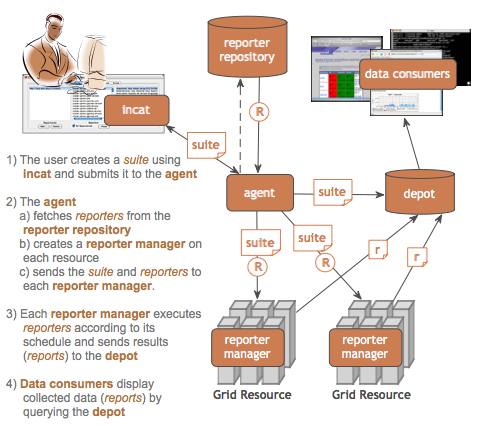
| A reporter is an executable program that tests or measures some aspect of the system or installed software. |
| A report is the output of a reporter and is a XML document complying to the reporter schema in Section 8.2.1. |
| A suite specifies a set of reporters to execute on selected resources, their configuration, and frequency of execution. |
| A reporter repository contains a collection of reporters and is available via an URL. |
| A reporter manager is responsible for managing the schedule and execution of reporters on a single resource. |
| A agent is a server that implements the configuration specified by the Inca Administrator. |
| incat is a GUI used by the Inca administrator to control and configure the Inca deployment on a set of resources. |
| A depot is a server that is responsible for storing the data produced by reporters. |
| A data consumer is typically a web page client that queries a depot for data and displays it in a user-friendly format. |
2. Requirements
The Inca server components have the following requirements:
Sun JDK or JRE 1.4.2_09 or greater. When run with Java 1.4, the memory usage of Inca components sometimes grows significantly over time. This appears to be a problem in the Java run-time that is fixed in Sun Java 1.5 and 1.6, so use those versions if possible.
Perl 5.8.6 or greater
OpenSSL-0.9.6[jkl] or OpenSSL-0.9.7b or greater
GNU tar (i.e., no limit on filename length)
Inca clients (reporter managers) running on *nix resources should have:
Perl 5.8.x or greater
OpenSSL-0.9.6[jkl] or OpenSSL-0.9.7b or greater
GNU tar (i.e., no limit on filename length)
make or gmake
a C compiler
Inca clients (reporter managers) running on Windows resources should have cygwin installed with the following modules (tested on XP):
ssh server
perl
make
gcc
openssl & openssl-dev
vim (not required for reporter manager but generally useful)
3. Recommendations
We recommend that Inca be run under a regular user account and not as root for the following reasons:
To best detect user-level problems, Inca should be run under a regular user account with the default environment setup.
Inca does not require any special privileges to run.
Furthermore, we recommend that a valid GSI credential be obtained for this regular user account so that tests of Grid software requiring proxy certificates can be executed. Please request a GSI credential from your virtual organization's Certificate Authority (CA) and consult your organization's security policy regarding GSI credential use. Section 5.7 describes using proxy credentials in the Inca framework.
4. Quick Start
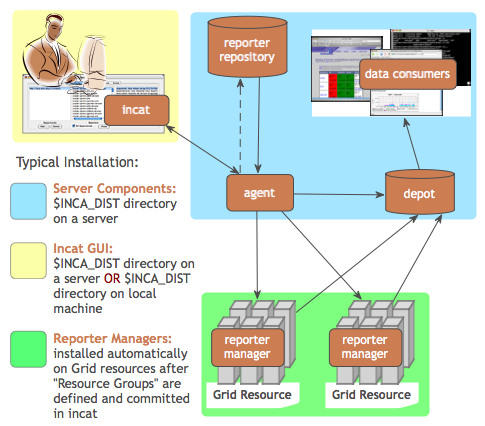
This section describes how to download, install and verify the Inca 2.6 binary release. The figure below represents a typical installation.
| Step 1: Download the installer script |
| Step 2: Run the installer script |
| Step 3: Change to the Inca installation directory |
| Step 4: Create credentials for Inca components |
| Step 5: Start up Inca components with a sample default configuration |
| Step 6: View the Inca web server pages |
| Step 7: View the sample default configuration using the Inca GUI tool |
Download the incaInstall.sh script:
% wget http://inca.sdsc.edu/releases/2.6/incaInstall.sh
Execute the install script to download the binary distribution from our website and unpack it into an installation directory. The installation directory is represented by the $INCA_DIST environment variable - it may be useful to set this variable now.
% sh incaInstall.sh $INCA_DIST core
$INCA_DIST is the location of the directory where you want to install Inca. You should see something like:
Retrieving http://inca.sdsc.edu/releases/current/
inca-common-java-bin.tar.gz
--12:49:38--  http://inca.sdsc.edu/releases/current/
inca-common-java-bin.tar.gz
=> `inca-common-java-bin.tar.gz'
Resolving inca.sdsc.edu... 198.202.75.28
Connecting to inca.sdsc.edu|198.202.75.28|:80... connected.
HTTP request sent, awaiting response... 200 OK
Length: 5,921,461 [application/x-tar]

100%[======================>] 5,921,461    1.23M/s  ETA 00:00

12:49:43 (1.18 MB/s) - `inca-common-java-bin.tar.gz'
saved [5921461/5921461]
...
common-java installed ...
agent installed ...
consumers installed ...
depot installed ...
incat installed
Change to the top level directory of your Inca installation:
% cd $INCA_DIST
Create certificates for the Inca components (enables secure component communication):
% ./bin/inca createauth
NOTE: the default life of 2.6 certificates is 5 years (1 year in earlier releases). To replace expired certificates, execute "bin/inca createauth" again to create new certificates and "bin/inca agent -u <resource group> -logfile var/upgrade.log" to update the certificates on the reporter managers.
Output from "bin/inca createauth" looks similar to the text below. When completed, you should see a certificate/key created for each of the four Inca components and stored in $INCA_DIST/etc:
password> (choose a password for your Inca installation administration)
Confirm password> (reenter the same password)
Generating a 512 bit RSA private key
.++++++++++++
writing new private key to 'clientx.sdsc.edukey.pem'
-----
agent
Generating a 512 bit RSA private key
.++++++++++++
writing new private key to 'agentkey.pem' ...
writing new private key to 'consumerkey.pem' ...
writing new private key to 'depotkey.pem' ...
writing new private key to 'incatkey.pem' ...
Start the Inca server components and deploy the sample default configuration (NOTE: this command only needs to be executed ONCE. The components started in this step can later be stopped with "./bin/inca stop all" and started with "./bin/inca start all". A restart command is also available). The Inca server components are agent, depot, and consumer and will be started on ports 6323, 6324, and 8080 respectively. Please edit the inca.properties file in etc/common to change the default ports for the agent and depot. For the consumer, the port number can be customized in etc/jetty.xml. More information can be found in Section 11.
% ./bin/inca default
You should see something like:
password> (enter password from the last step)
Preparing to deploy default Inca configuration...
Initializing Inca configuration...
** Warning:  this will erase any previously collected reporter
    state on the Inca depot and configuration on the agent
    Do you wish to continue (y/n)? y
Initializing depot...
Initializing c3p0 pool... com.mchange.v2.c3p0.PoolBackedDataSource@90....
Database Initialization Completed
done
Initializing agent
done
Started Inca agent
Started Inca consumer
Started Inca depot
Sleeping for 20 seconds while the components come online
Deploying default configuration
During this step:
three server components are started on localhost:
% ps | grep java
3527 p1 S 0:14.21 /usr/bin/java -Xmx256m edu.sdsc.inca.Agent -l agent.log
3560 p1 S 0:17.63 /usr/bin/java -Xmx256m edu.sdsc.inca.Depot -l depot.log
3593 p1 S 0:15.43 /usr/bin/java -Xmx256m edu.sdsc.inca.Consumer consumer.log
a sample test suite called sampleSuite is sent to the agent. The sample suite contains a schedule for executing each of the following reporters every ten minutes:
cluster.admin.ant.unit  			(ant_helloworld_compile_test)
cluster.admin.ant.version  			(ant_version)
cluster.compiler.any.unit  			(gcc_hello_world)
cluster.compiler.gcc.version  			(gcc_version)
cluster.compiler.any.unit  			(java_hello_world)
cluster.java.sun.version  			(java_version)
cluster.interactive_access.openssh.version	(openssh_version)
cluster.security.openssl.version		(openssl_version)
viz.lib.vtk-nvgl.version			(vtk-nvgl_version)
grid.wget.unit					(wget_page_test)
a client component is started on localhost:
% ps | grep Manager
5382 p1 S 0:02.14 /usr/bin/perl reporter-manager
                  -d incas://client64-236.sdsc.edu:6324 -c etc/rmcert.
The agent receives sampleSuite suite and installs a reporter manager on the localhost in ~/incaReporterManager (takes 1-5 minutes - view progress of build in ~/incaReporterManager/build.log)
After the reporter manager is built, it registers itself with the agent. The agent will send the reporter manager the set of reporters, libraries, and execution schedule.
The reporter manager executes reporters based on the execution schedule and sends reports to the depot.
To view results and verify that your Inca installation is working correctly, open the URL below in a browser. Starting a web server is not required, but you may need to replace "localhost" with the full hostname of your machine.
http://localhost:8080
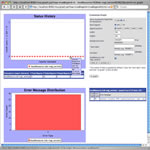
You should see a start up screen similar to the figure below initially indicating an empty Inca configuration.
After a few minutes (when the consumer cache is refreshed), reload the page and you should see a start up screen similar to the figure below showing one suite called sampleSuite (our default sample configuration), a resource group called defaultGrid, a resource group called localSite, and one resource called localResource which is a nickname for the machine you installed an Inca reporter manager on.
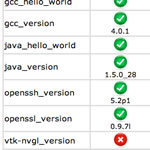
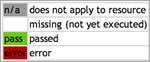
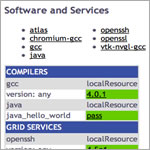
Select sampleSuite and defaultGrid and press the Submit button. You should see a page similar to the figure below with the reporter series scheduled to execute on localhost. The reporters test a small set of compiler, grid services, math library and scientific visualization packages. Each reporter may perform a software package version query (e.g., gcc) and/or unit test (e.g., java -- unit test name is java_hello_world). Most boxes should be have the ? icon indicating that the reports have not yet been received.
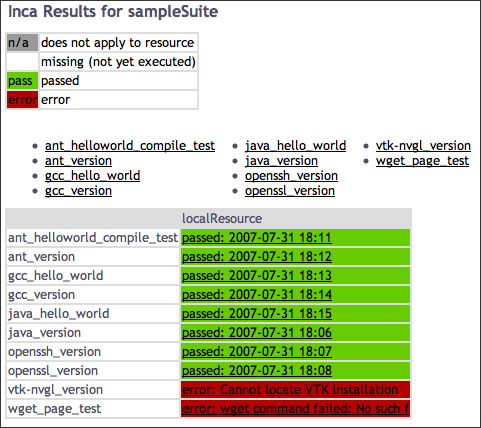
Refresh the page after a few minutes and you should begin to see more boxes filled in until it looks like the below figure. If you do not see a results filled in, check the .log files in $INCA_DIST/var for ERROR or Exception. See Section 13.1 for more information about logging.
You can also navigate to this page from the "table of sampleSuite results" link under "Current Data" in the page header.
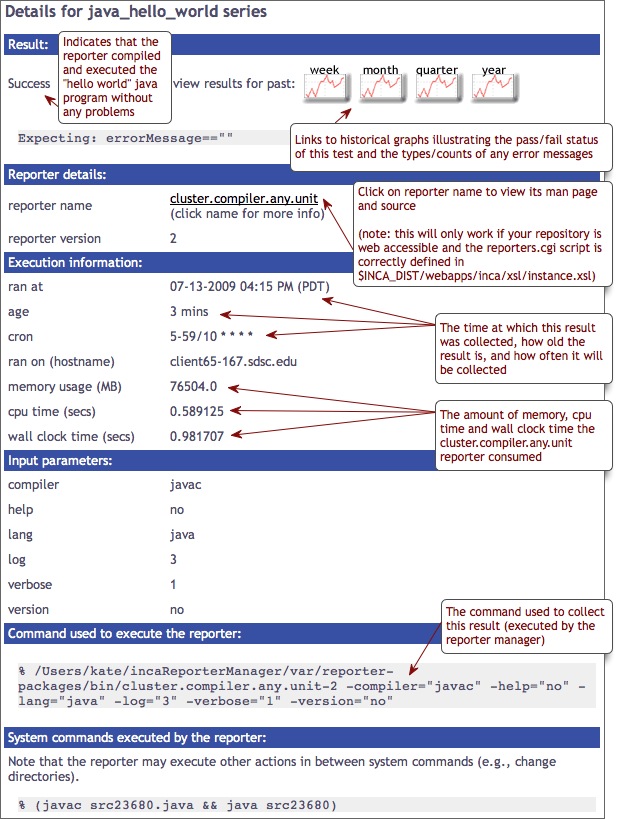
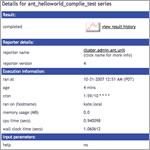
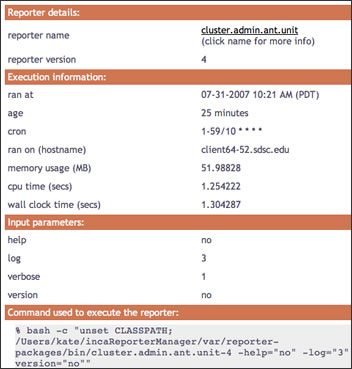
Click on any red/green box to see the details of how the result was collected. The figure below shows the details of the cluster.compiler.any.unit reporter that compiles and executes a small hello world java program.
View the Inca sample default configuration using the Inca GUI tool, incat (Inca Administration Tool). You can use incat to make changes to the default configuration (e.g., add a new resource to defaultGrid or add new tests to sampleSuite). See Section 5 for more information about using incat.
Use the following command to start incat:
% ./bin/inca start incat -A localhost:6323
You should now see the Java GUI window appear on your local machine. If you don't see Java GUI windows pop up like those in Figure 8 and Figure 9, it is probable that X-Window forwarding is not set up correctly between the machine where you installed Inca and your local machine. You can either configure X-Window forwarding, or you can start incat on a local machine as described in step 8.
Once incat has information from the agent, the following screen will display:THIS STEP IS OPTIONAL. If you don't see Java GUI windows pop up like those in Figure 8 and Figure 9, you can use this step to install incat on a local machine.
Copy the incaInstall.sh script to a local machine.
% wget http://inca.sdsc.edu/releases/2.6/incaInstall.sh
Install incat on a local machine:
% ./incaInstall.sh $INCA_DIST incat
Copy the incat key, certificate, and trusted directory from the original machine to your local machine:
% scp orig.machine:$ORIG_INCA_DIST/etc/incatkey.pem $INCA_DIST/etc/
% scp orig.machine:$ORIG_INCA_DIST/etc/incatcert.pem $INCA_DIST/etc/
% scp "orig.machine:$ORIG_INCA_DIST/etc/trusted/*" $INCA_DIST/etc/trusted/
Start the incat component on a local machine with the agent hostname from the original machine:
% cd $INCA_DIST; ./bin/inca start incat -A ORIGHOST:6323 &

5. Administering Inca with incat
Inca provides a graphical administration tool, named incat, that allows you to configure your deployment. Using incat, you can specify the repositories from which Inca should retrieve reporters, the hosts where you wish to run reporters, and which reporters you wish to run on each host.
You can connect incat to a running Inca Agent via the -A option, e.g., "cd $INCA_DIST; ./bin/inca start incat -A localhost:6323".
As mentioned in the Quick Start guide, you can execute "./bin/inca default" from the command line to install a default Inca configuration. The discussion below describes how you would use incat to specify the same configuration. Before continuing, use the inca script to start both a Depot and an Agent on your host.
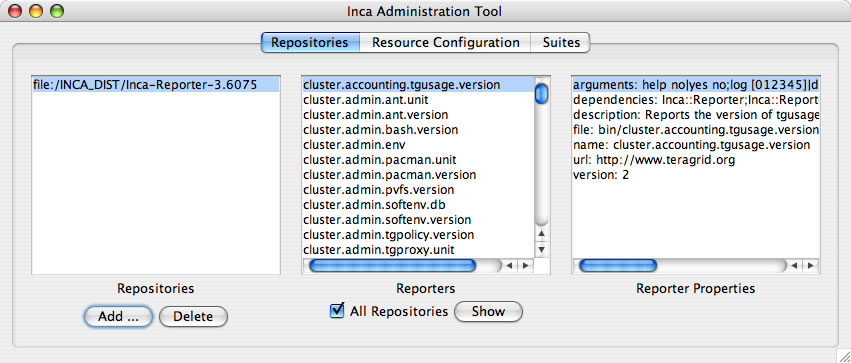
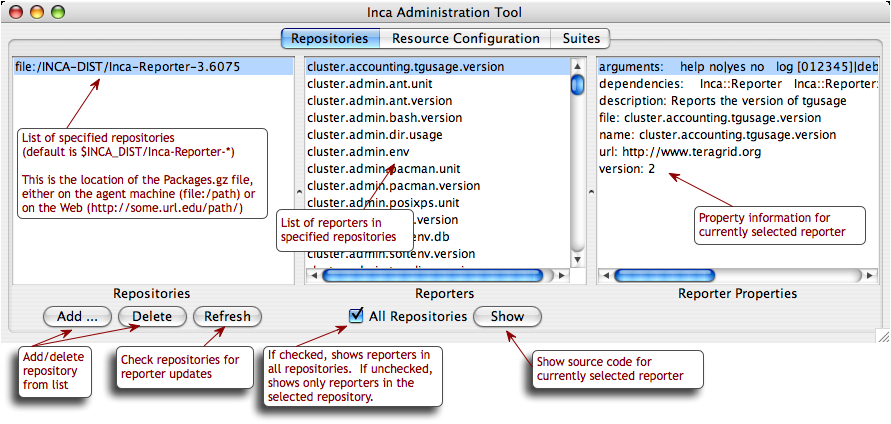
5.1. Repositories
Incat begins by showing the panel for Inca reporter repositories (as shown in Figure 10). The default Inca configuration retrieves reporters from the $INCA_DIST/Inca-Reporter-* repository on the agent machine. To add this repository to your list, press the Add button in the Repositories section, enter the file:/ location of the Packages.gz file in the pop-up window that appears, then press the OK button. Within a few seconds you should see the repository appear in the Repositories list, a set of reporters in the Reporters list, and properties for the first reporter in the Reporter Properties list. Reporter source code is viewable by double clicking on a reporter name or by selecting the reporter name and pressing the "Show" button.
5.2. Resource Configuration
The default Inca configuration defines three resource groups -- a group called "localResource" that specifies the host where the Inca Agent will launch a new Reporter Manager (localhost) and two container groups called "localSite" (contains "localResource") and "defaultGrid" (contains "localSite") that can be extended to include any other hosts running Reporter Managers. The default resource configuration is shown is Figure 11.
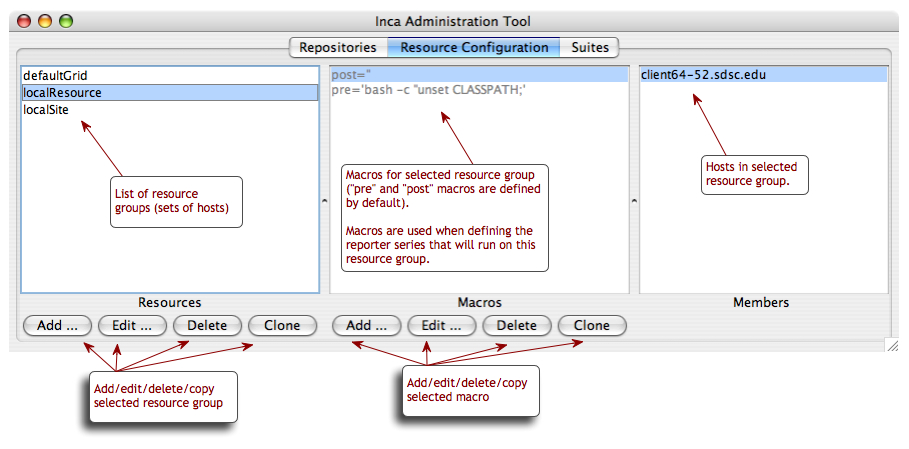
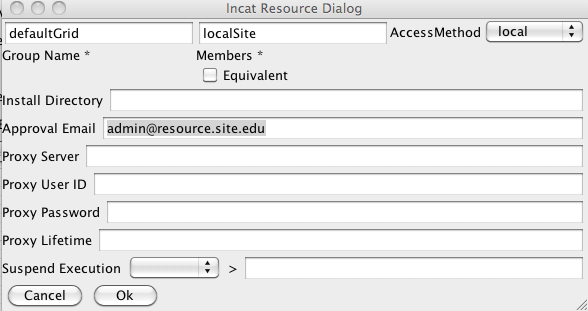
The configuration above can be duplicated in an empty Inca installation by pressing the Resource Configuration tab near the top of the incat window and then entering information about the hosts on which you want Inca to run reporters. To define the default groups above in incat, press the Add button in the Resource Groups section to open the resource group edit dialog shown in Figure 12.
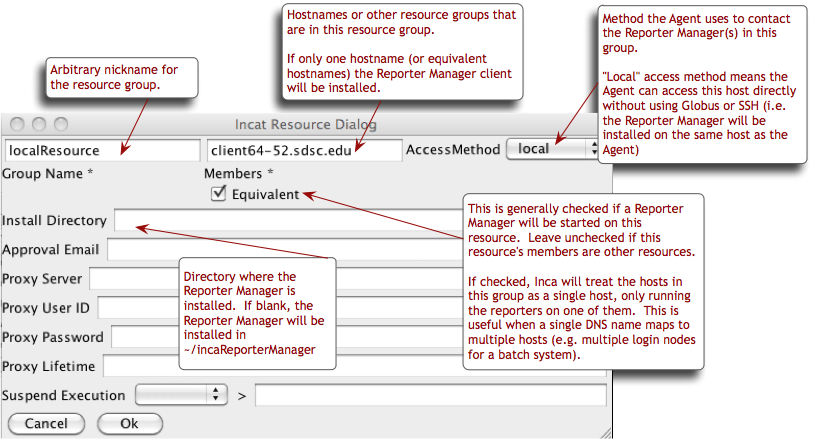
In the Group Name text box, enter the name "localResource" as a nickname for the machine the Reporter Manager client runs on. Enter "localhost" in the Members text box and select "local" as the access method (for a description of access methods see Section 5.5). Press OK to complete entry of this resource group. Incat will close the resource group edit dialog and will display localResource in the Resource Groups section of the Resource Configuration panel.
Press the Add button again to add a second resource group. Give this one the name "defaultGrid" and enter "localResource" in the Members text box. This tells incat that any hosts in the "localResource" group (localhost, in this case) are also part of the defaultGrid group. If you defined other groups, "siteB", "siteC", etc., you could include these in defaultGrid by listing them in the Members text box, separated by spaces. Press OK to complete entry of this resource group. In the Resource Groups list, select each group and notice that localhost is listed in the Members panel.
5.3. Suites
Pressing the Suites tab near the top of the incat window takes you to incat's suite/series specification panel. Here you specify the reporters you want to run, the resource groups to run them on, how frequently to run them, and the arguments to use when running them.
The default Inca configuration defines a single suite named sampleSuite that contains eight series as shown in Figure 13.
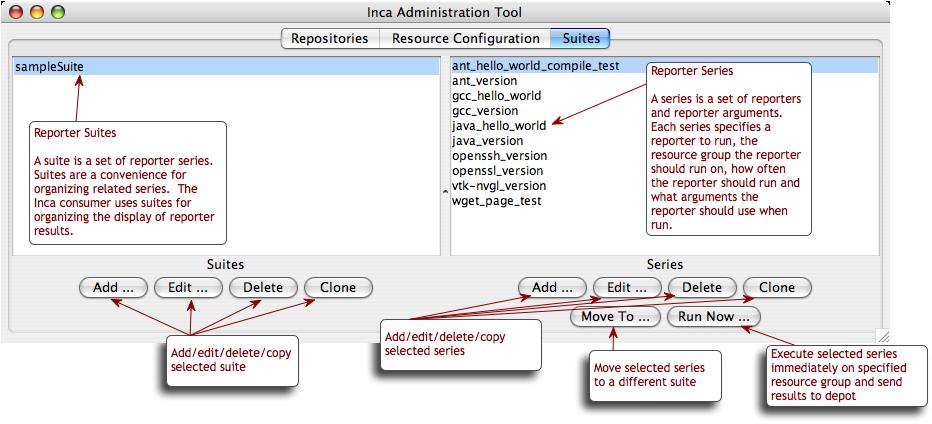
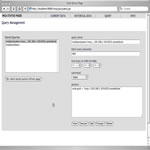
In a new Inca installation, you can add the default suite above by pressing Add button in the Suites section of the panel, entering "sampleSuite" in the pop-up window, then pressing the OK button. To add series to the new suite, press the Add button in the Series section to open the incat series dialog and configure each like the gcc_hello_world series in Figure 14.
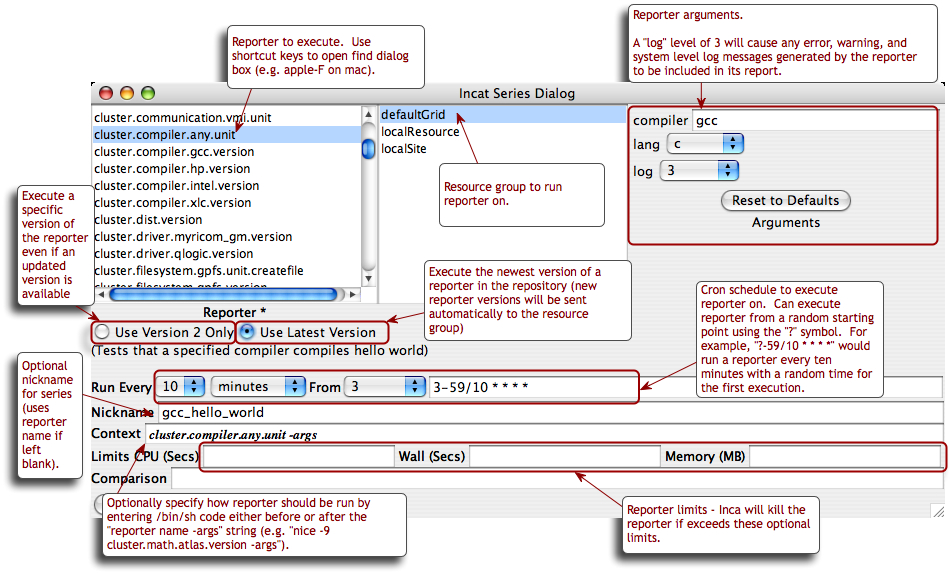
The bottommost box in the series dialog allows you to test the output of the reporter and send email or take other actions if the test fails. This is covered in Section 5.10 below; for this series leave this box blank. Press the OK button, and incat will close the series dialog box and add the series to the Series list in the suite/series specification panel.
The other nine series in the default Inca configuration are composed similarly to the first one. Press the Add button in the series section for each of them, then set the values in the series dialog as specified in the table below. Set the log argument for each series to 3 and the frequency to 10 minutes.
Table 1. Default Configuration Series
Reporter | Nickname | Arguments |
|---|---|---|
cluster.admin.ant.unit | ant_helloworld_compile_test | |
cluster.admin.ant.version | ant_version | |
cluster.compiler.gcc.version | gcc_version | |
cluster.compiler.any.unit | java_hello_world | compiler: javac; lang: java |
cluster.java.sun.version | java_version | |
cluster.interactive_access.openssh.version | openssh_version | ssh: ssh |
cluster.security.openssl.version | openssl_version | |
viz.lib.vtk-nvgl.version | vtk-nvgl_version | |
grid.wget.unit | wget_page_test | page: http://cnn.com/index.html |
5.4. Committing/Saving
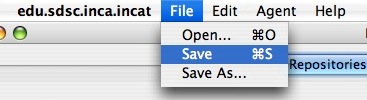
Your Inca deployment configuration is now complete. At this point, it's a good idea to use the "Save" option in incat's File menu to write the configuration to a file (Figure 15). That way, you have a local copy of the configuration that you can later modify. The file is formatted XML; if you're curious, you can read through it to see how incat represents the information you've entered.
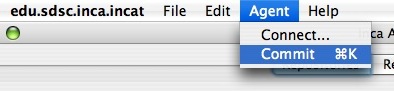
Although your configuration is complete, it's not yet active. To tell Inca to begin running reporters, you need to have incat send your configuration to your Inca Agent. If you started incat with the -A argument, then you're already connected to your Agent. Otherwise, use the "Connect" option in incat's Agent menu to establish a connection. Once you're connected, you can use the "Commit" option in the Agent menu to send the configuration to the Agent (Figure 16). In response, the Agent will install the Inca Reporter Manager code on the host specified in incat's "Resource Configuration" panel and begin running the reporters you specified in the "Suite Series" panel.
5.5. Resource Access Methods
The Inca Agent can use the following access methods to stage and start Reporter Managers on resources:
ssh:
The most common access method. The Agent starts a Reporter Manager on a remote machine using ssh to access the remote machine. The Agent must have ssh key access to the remote machine. Reporter Manager files are copied from the Agent to the remote machine using sftp. For ssh resource groups, incat provides text boxes for you to enter the login id, password, and path to the ssh key file on the Agent machine. For security purposes, incat displays asterisks for the password and encrypts it when you save the configuration to a file.
globus2:
The Agent starts a Reporter Manager on a remote machine using Globus PreWS to access the remote machine. Reporter Manager files are copied from the Agent to the remote machine using GridFTP. When you select globus2 in the Access Method pull-down, incat provides text boxes for you to enter contact information for the resource's Globus GRAM and GridFTP servers. If you leave these boxes blank, Inca defaults to ports 2119 and 2811, respectively, for the first host in the resource group's member list. Access to Globus hosts requires an active Globus proxy on the Agent's host. You can either create a manual proxy on the Agent machine before starting, or you can store a proxy on a myproxy server and complete the four incat proxy dialog boxes (see Section 5.7) so that the Agent can obtain one as needed.
globus4:
The Agent starts a Reporter Manager on a remote machine using Globus WS to access the remote machine. Reporter Manager files are copied from the Agent to the remote machine using GridFTP. When you select globus4 in the Access Method pull-down, incat provides text boxes for you to enter contact information for the resource's Globus WS GRAM and GridFTP servers. If you leave these boxes blank, Inca defaults to ports 8443 and 2811, respectively, for the first host in the resource group's member list. Access to Globus hosts requires an active Globus proxy on the Agent's host. You can either create a manual proxy on the Agent machine before starting, or you can store a proxy on a myproxy server and complete the four incat proxy dialog boxes (see Section 5.7) so that the Agent can obtain one as needed.
local:
The Agent starts a Reporter Manager on the same machine where the Agent is running (localhost).
manual:
Entering a manual resource group indicates that you want complete, direct control over Inca execution on the group. For a manual resource group you must start the Reporter Manager on the command line and restart it any time you want to change the reporter series configuration for the group. The Agent will NOT automatically start a Reporter Manager for a manual resource as it will for local, ssh, or globus2 resources. See Section 11.6 for more details.
5.6. Requiring Resource Administrator Approval
By default, Inca installation changes take effect automatically once you commit them to the Agent. In circumstances where Inca changes must be approved before they take effect, enter the approver's email address in the "Approval Email" text box of the resource edit dialog. When changes to the Inca installation on this resource are committed, Inca will send approval instructions to the email specified in the resource dialog. Note that a run now request as described in Section 5.3 is not considered a change and will be forwarded automatically if that series has already been approved.
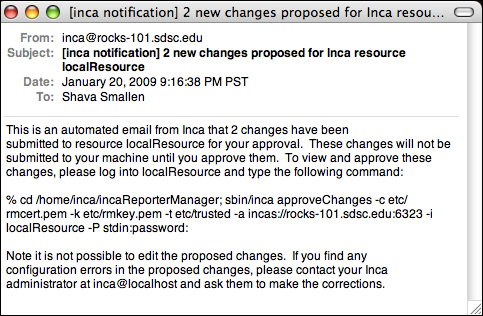
The emailed approval instructions will look like the image below by default and will describe how changes can be approved using Inca's approveChanges command. To customize the approval instruction email edit $INCA_DIST/etc/approveEmail.txt.
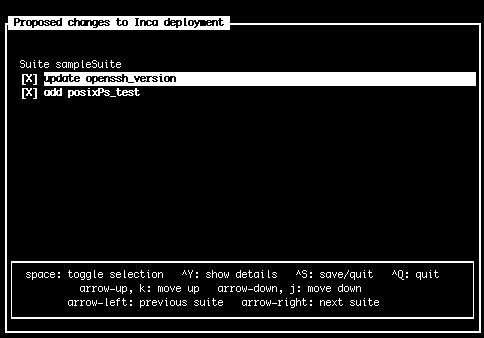
The approveChanges command allows viewing and approval of the individual changes committed using incat. Use the --help flag with the approveChanges command to see all possible options. After approveChanges is invoked, the approver will see a text menu like the one in the screen below with a list of proposed changes. More information about each change is viewable by hitting ctrl-y. By default all changes are checked. If any proposed changes are incorrect for their system, the approver should uncheck them by hitting space. After checking only correct changes for their resource, the approver should hit ctrl-s to approve the selected changes. The Agent will only transmit approved changes to the resource. The proposed changes not approved will remain in the queue and indicate that the Inca administrator has incorrect information about the resource. The approver should notify their Inca administrator of these errors to correct their proposed changes list.
The image below shows an example of more information about a change (viewable by hitting ctrl-y). In this example a change to the series logging is represented by the before and after values separated by the "=>" symbol and the green color highlighting the new log and context values. If colors aren't viewable in your terminal, try setting the TERM environment variable to "xterm-color".
Here the approveChanges command was invoked using the --color=blue,red,green flag to show unchanged attributes in blue, changed attributes in red and new values in green. Edit the $INCA_DIST/etc/approveEmail.txt file to add your own color preferences.
5.7. Proxies
For convenience, the Inca framework can be used to retrieve a proxy for the globus2 access method or for reporters that require an active proxy. Reporters that require a proxy should use the Inca::Reporter::GridProxy module described in Section 8.2.3.
Before configuring Inca to retrieve proxies, first store a proxy on a myproxy server. For information about setting up a myproxy server or storing proxies on a server, please see the official myproxy documentation.
The Agent can automatically retrieve a proxy from a myproxy server if the proxy information is defined in incat as follows:
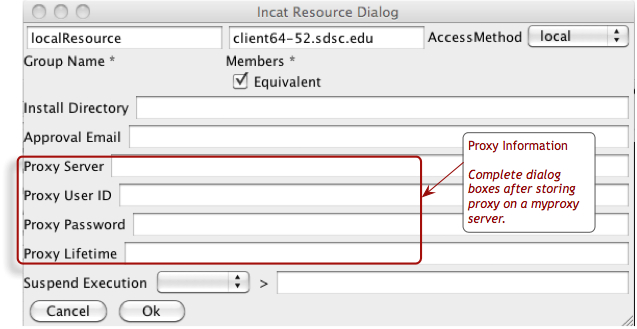
The dialog boxes are the hostname of the myproxy server, the username and password used to store the proxy, and the lifetime in hours that the agent should retrieve a proxy for (the default is 12 hours).
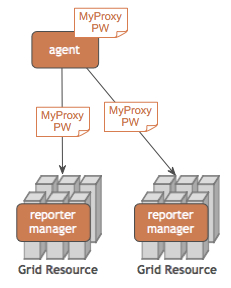
Once proxy information is committed to the agent, it can be retrieved by reporter managers. Each time a reporter manager is ready to run a reporter that needs a proxy it:
requests the MyProxy passphrase from the agent
uses the MyProxy command-line client to retrieve proxy credentials from a MyProxy server
clears the MyProxy passphrase from memory
The MyProxy passphrase is stored on the agent in the $INCA_DIST/var/resources.xml file and is encrypted with the same passphrase as the agent's private key. The MyProxy passphrase passes between the reporter manager and agent over their SSL connection.
5.8. Suspend Execution
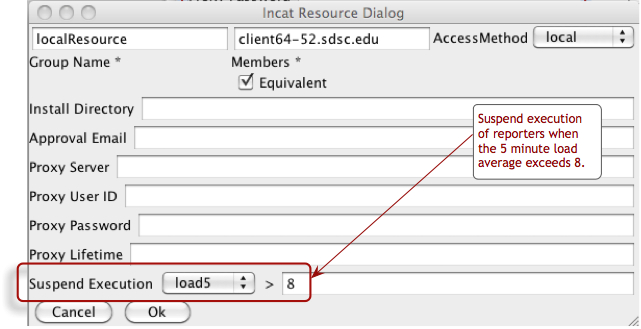
If you would like the reporter manager to suspend execution of reporters when a machine is under high load, you can specify a specific load value as shown in the figure below. When the reporter manager detects a load higher than the specified value, it will skip execution of the reporter and instead return a specific report indicating that the reporter was not executed due to high load. The consumer will then display it as a neutral value in the display of the reporter history. Specify the specific load average number of either 1, 5, or 15 minutes (load1, load5, or load15) and the load value as an integer.
5.9. Using Resource Macros
Resource macros provide a shorthand for defining multiple, similar series. For example, suppose you wanted to add three series to the configuration defined above to measure the ping time to three different hosts, named blue.ufo.edu, green.ufo.edu, and red.ufo.edu. One approach would be to define a series for blue, use the Clone button in the Series section of the Suites panel to make two copies, then modify them to ping green and red.
A better approach is to use a macro for the host names and let Inca replicate the series for you. In the Resource Configuration panel, click on defaultGrid in the Resource Group section. Next, press the Add button beneath the Macros section. This opens a dialog box that allows you to enter the name and value(s) of a macro associated with the current resource group.
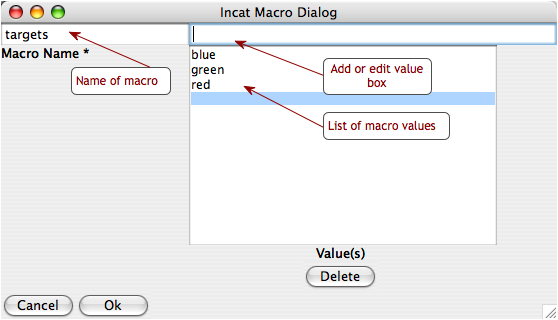
Enter "targets" in the Macro Name text box and "blue" in the macro value edit box, then use the "Add" button or hit "enter/return" to add "green" and "red" as the second and third values of the macro. Afterwards, press OK. The definition of the targets macro now appears in the Macros section of the Resource Configuration panel. You may also edit values in the list by selecting them, changing the value in the edit value box, and hitting "enter/return". To delete macro values, select the value in the list and press the "Delete" button.
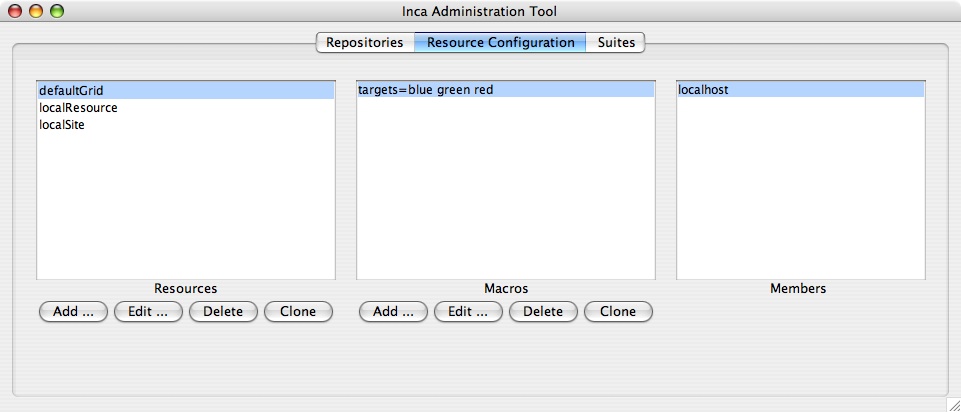
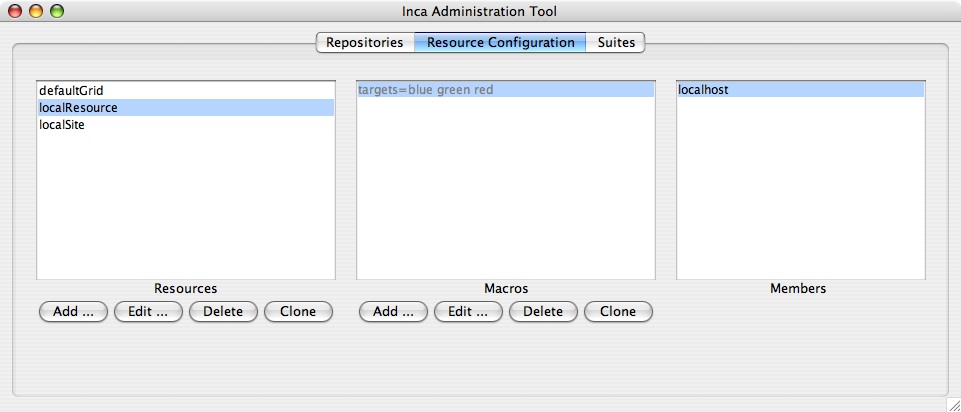
The targets macro is also defined for the other resource groups since the defaultGrid contains all other groups. As shown in Figure 17, macros appear grey if they were defined in a resource group other than the one selected. You can override an inherited macro value by selecting the macro in the Macros panel and pressing the Edit button to open the macro edit dialog. After you change the macro value and press OK, the updated macro definition will show in black in the Macros panel, indicating that the resource is no longer using the inherited value.
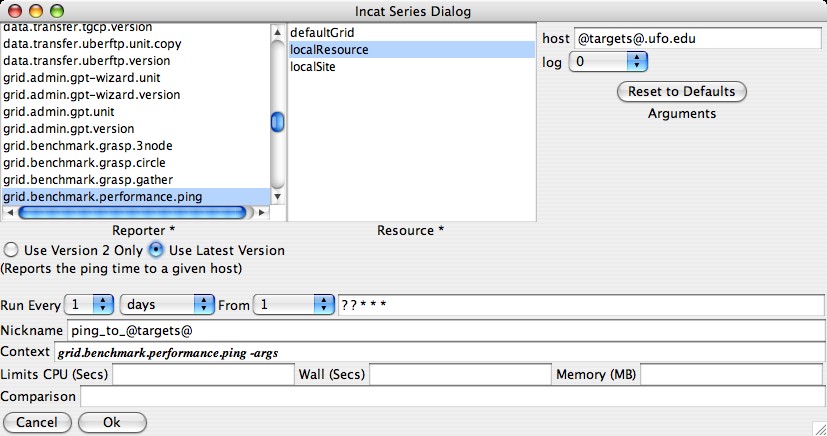
To make use of the macro you've defined, click the Suites tab, then press the Add button underneath the Series section to open the series edit dialog. In the dialog, set the reporter to grid.benchmark.performance.ping and the resource group to localResource.
In the host text box in the Arguments section of the dialog, enter "@targets@.ufo.edu". Macro references in incat are indicated by placing a "@" before and after the macro name. When the Inca Agent encounters a macro reference in a series, it makes one copy of the series for each value of the macro. Since the targets macro has three values--blue, green, and red--the Inca Agent will make three copies of this series, substituting a single value for the macro reference in each. In this case that means that you'll have one series with a host argument of "blue.ufo.edu", one with a host argument of "green.ufo.edu", and one with a host argument of "red.ufo.edu".
The inca web pages use the series nickname when displaying series results. If you leave the series nickname with its default value, the name of the reporter, then all three series will have the same nickname. Instead, you can enter "ping_to_@targets@" in the nickname text box. The Inca Agent will expand this reference in parallel with the reference in the host argument, so your three series will have the nicknames ping_to_blue, ping_to_green, and ping_to_red, respectively.
5.9.1. Using Macros from Other Resources
Sometimes it's useful to configure a series with macros from resource groups besides the one the test will execute on. For example, if a test will execute on a local resource to ping a group of remote resources, it would be helpful to use the macro for the hosts defined in the remote resource group. In the image below, we add a new group called "remoteGrid" to the default Inca configuration. The "remoteGrid" group contains two resources "remoteResourceA" and "remoteResourceB". Each of these two resources has a macro called "gramHost" defined with a GRAM gatekeeper hostname for that resource.
Now we set up a ping test that is scheduled to execute on the "localResource" group, but is configured using the "__incaHosts__" macro from the "remoteGrid" group. The only difference in syntax is to add the resource group name and an arrow to the macro name as in the image below. Since we're executing on "localResource", we have to add a "remoteGrid->" to the front of the macro name in order to get that group's macro values.
In this example we use the "__incaHosts__" macro, which is a special macro that is automatically created by Inca for each resource group and resolves to the leaf hostnames of each resource group. So the series configuration in the image below will create two ping tests to execute on "localResource": one that pings the hostname of "remoteResourceA" (sapa.sdsc.edu) and one that pings the hostname of "remoteResourceB" (cuzco.sdsc.edu). This is because we're getting all the values of the "remoteGrid" group's "__incaHosts__" macro, and the "remoteGrid" group contains "remoteResourceA" and "remoteResourceB".
We could also configure another series that is identical to the one shown in the image above except we replace the "__incaHosts__" macro with the "gramHost" macro. In this case, the two new ping tests will ping the "gramHost" hostname of "remoteResourceA" (gatekeeper.sapa.sdsc.edu) and the "gramHost" hostname of "remoteResourceB" (gatekeeper.cuzco.sdsc.edu).
5.9.2. Configuring "all2all" Series
The "all2all" test results are calculated by the consumer. Generally "all2all" series are cross-site tests. The images below illustrates an example of configuring an "all2all" ping series.
First a new suite called "cross-site" is added to contain the series for our "all2all" tests:
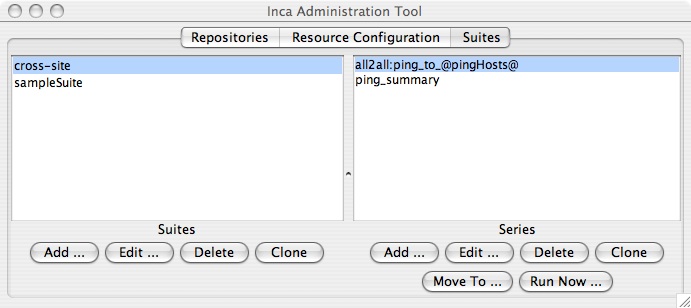
Next we select the cross-site test that we'll execute (grid.benchmark.performance.ping) and configure the targets with a "pingHosts" macro. The consumer detects that this is an all2all series because the nickname and context contain all2all strings as described in the image below:
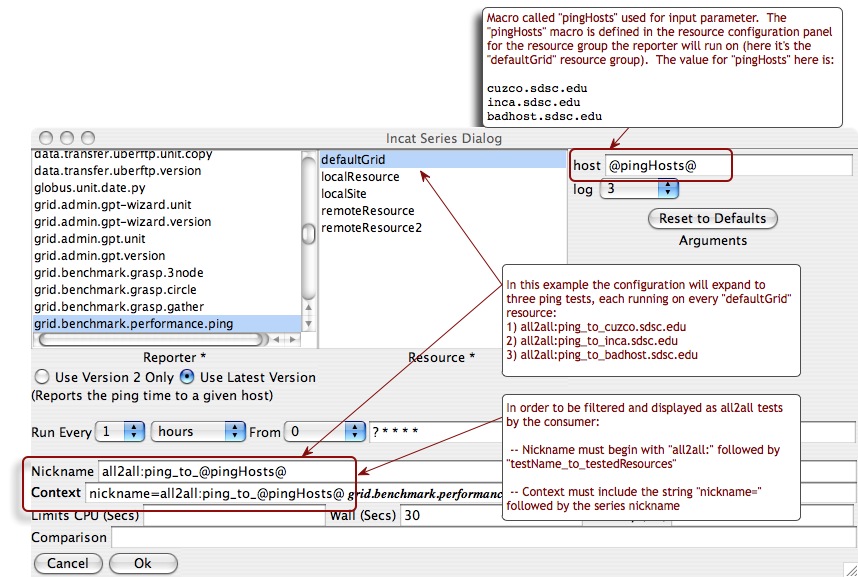
In addition to configuring the actual all2all tests, we also configure a summary series for the latest pass/fail results of each all2all test. This summary will be used by the All2AllFilter described in Section 11.3.2 to determine which resource is responsible for a failure. For example, in the example above we created an all2all ping test to be executed on the defaultGrid resource group. Each of defaultGrid resources is pinging three other resources: cuzco.sdsc.edu, inca.sdsc.edu and badhost.sdsc.edu. The summary series will find the latest results for each of the resources being pinged in order to assess whether a new failure is the fault of the resource doing the ping or the resource being pinged. For example, if two of the three resources in the defaultGrid group are unable to ping badhost.sdsc.edu, when the third resource in defaultGrid goes to ping badhost.sdsc.edu and fails we know that it's the fault of badhost.sdsc.edu and not the third resource (or subsequently any other resource until badhost.sdsc.edu is fixed). Based on the results of the summary series, the All2AllFilter would mark this third resource as "NOT_AT_FAULT" for failing to ping badhost.sdsc.edu.
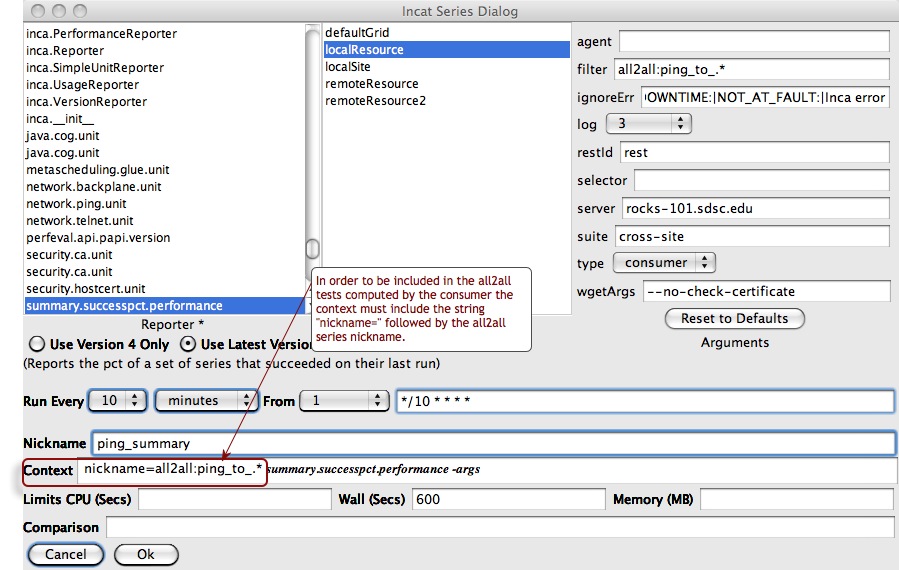
To configure a summary series for all2all tests, make a new series that will execute the "summary.successpct.performance" reporter with the following parameters:
"Context": contains a similar "nickname=all2all:testName_to_.*" string as the all2all tests being summarized. Note that ".*" replaces the "@pingHosts@" macro used above since we're only creating one series.
"filter": same as the Context string minus "nickname=". The reporter will get the latest results for all series whose nickname matches this string.
"ignoreErr": the regular expression that the summary reporter looks for in error strings when counting failures and if it finds it then the errors are marked neutrally.
"restId", "server" and "type": tell the reporter where to get the latest test results (in this example via the consumer at rocks-101.sdsc.edu using the "rest" URL).
"suite": the suite the all2all tests being summarized can be found in.
"wgetArgs": extra arguments to use when wget'ing the test results.
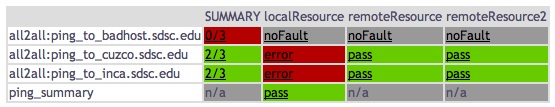
The results of the all2all tests configured above are shown in the following image. Note that while the single summary series produces all the boxes in the "SUMMARY" column, each of the other boxes represents a unique series.
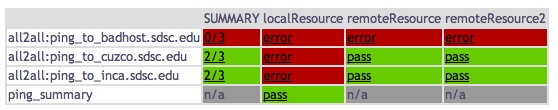
After we add the All2AllFilter described in Section 11.3.2 the results also show when an individual resource is not at fault for the error. Error messages are prefixed with "NOT_AT_FAULT" and marked neutrally in stylesheets ("noFault") and history graphs:
5.10. Series Comparison and Notification
For a particular series, the Inca system by default reports only whether or not the series reporter was able to execute successfully--whether a version reporter was able to determine a package version, a unit reporter was able to run a program, etc. Using Inca's comparison and notification feature, you can refine a series to define success more precisely and to receive notification from Inca when a series reporter detects a problem. The bottom text boxes of the series edit dialog provide access to Inca's comparison and notification feature.
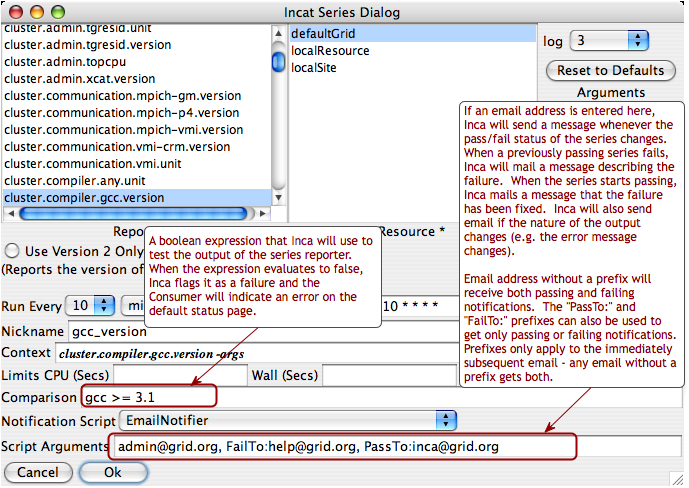
The comparison expression can test the content of the report body, the content of the report error message, or the value of any symbols defined in the report body by <ID> tags. The expression may use any of the boolean operators <, <=, >, >=, ==, and !=, plus perl's pattern match (=~) and mismatch (!~) operators. One simple test would be "body =~ /./", which would test whether the report body contained any characters. Tests can be joined together by the && and || operators. Using these, you could ignore an expected, minor error with the test "body =~ /./ || errorMessage == 'Try again later'".
As mentioned above, you can include symbols defined in the report body in your tests. The Inca system uses the content of any subsequent tag as the symbol value. For example, the body of the output of the gcc version reporter might be
  <body>
    <package>
      <ID>gcc</ID>
      <version>3.1</version>
    </package>
  </body>
|
Here, Inca will use "3.1" as the value of the symbol "gcc". With this output, the comparison test "gcc >= 3.0" would succeed, while the comparison "gcc == 3.0" would fail. If the report body contains an <ID> tag with no subsequent tag, the value of the symbol is defined to be "".
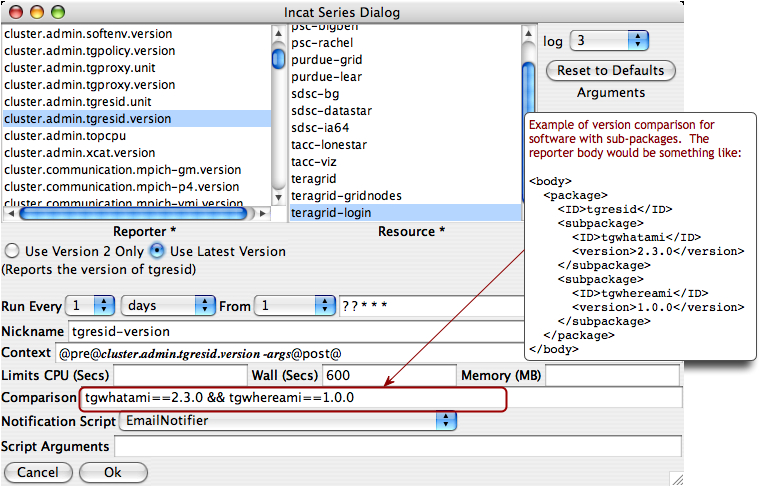
The image below illustrates how a comparison for subpackage versions would be configured.
Inca supports the ability to run a script that notifies you of changes in a series comparison. When you specify a series comparison in the incat series dialog, two additional components become visible. The Notification Script pull-down menu allows you to select the script to run, and the Script Parameters text box allows you to enter parameters to pass to the script. By default, the Inca installation provides two notification scripts, EmailNotifier and LogNotifier. The first sends email to each address specified by the script parameters; the second writes a message to the specified log file. See Section 11.2 for directions on customizing the notifications you receive.
6. Data Display (Data Consumers)
The data that the Inca depot stores can be displayed in many ways, such as current status reports, historical graphs, and customized status information. An Inca data consumer is anything that retrieves data from the depot and displays it (e.g. a JSP, SQL query, CGI, etc.). The Inca depot provides access to stored data via Perl and Java client APIs (see Section 7.2.3).
The data consumer packaged with Inca is a collection of JavaServer Pages (JSP) and associated files. The consumer is installed in $INCA_DIST/webapps/inca and is deployed with Jetty when the consumer is started (e.g., ./bin/inca start consumer). The consumer listens on ports 8080 (HTTP) and 8443 (HTTPS) unless $INCA_DIST/etc/jetty.xml is edited as described in Section 6.12.
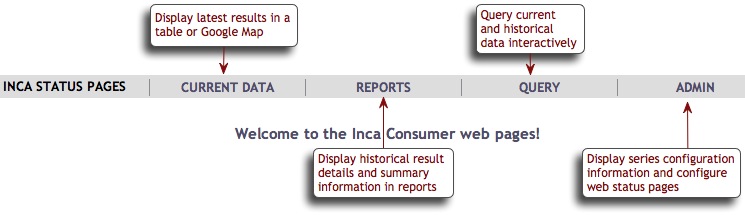
The default consumer's JSPs query the depot for XML results and either apply XSL to them in order to display HTML status pages or parse out data and display it in graphs. The figure below shows the default menu header. Each menu item invokes a JSP as described in the sections below.
6.1. Current Data
The default page header navigation contains links to tabular and map view result summaries for the sample suite. To add other current data pages under this heading (e.g., result summary tables for additional suites), customize the header.xsl file as described in Section 6.9.3.
6.1.1. Tabular Suite Summary View
The first item in the CURRENT DATA menu executes status.jsp with default.xsl to create a summary table of suite results. This JSP takes comma-delimited lists in its suiteNames and optional resourceIds parameters that specify the suites and resources to be shown. The default installation invokes http://localhost:8080/inca/jsp/status.jsp?suiteNames=sampleSuite&resourceIds=defaultGrid, producing an image similar to this one:
6.1.2. Map View using Google Map API
6.1.2.1. Overview
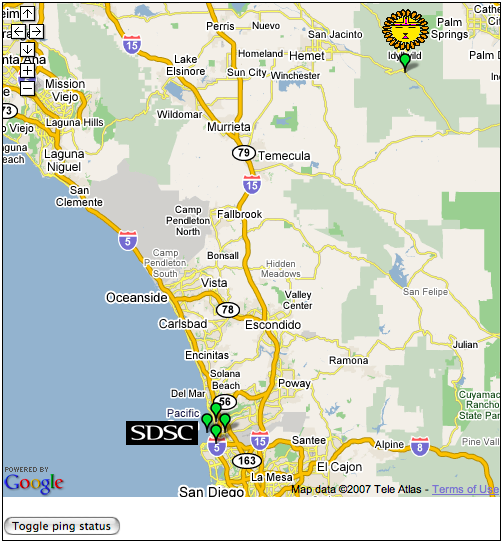
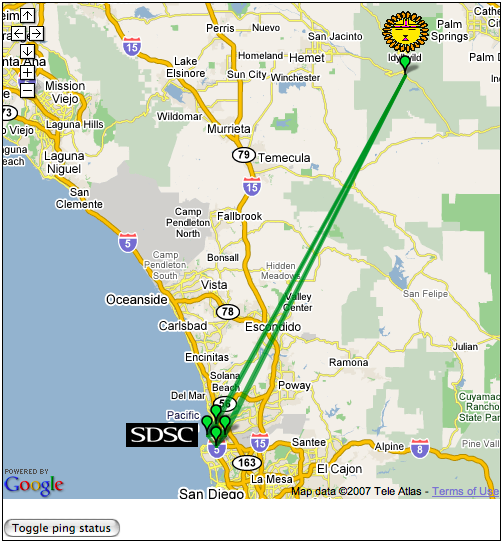
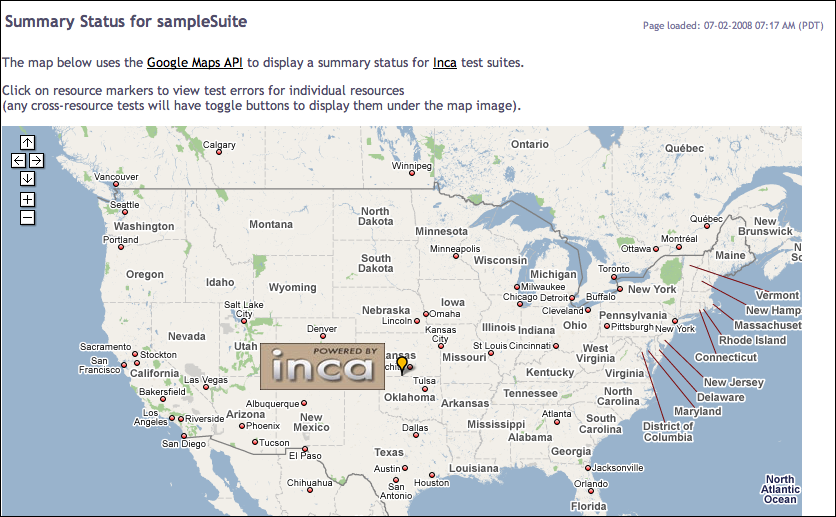
The second item in the CURRENT DATA menu executes status.jsp using google.xsl to display a map that provides a summary of the current status of resources. For each resource, the map view gives the percentage of reports passed, number of passed reports, number of failed reports, and a list of the failed tests with a link to each report details page. A resource is represented on the map as a marker and colored red, green, or orange based on the number of tests that have passed and/or failed. The figure below shows the Inca Google map view for the NEON testbed (four resources at SDSC and one resource at James Reserve). All resources are passing their tests, so every resource marker is green.
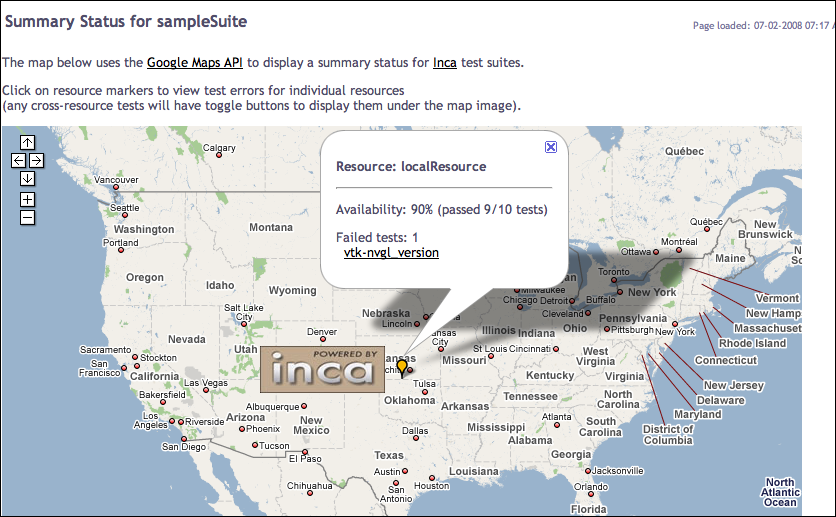
Clicking on a marker displays a pop-up with the name of the resource and its status information as show below.
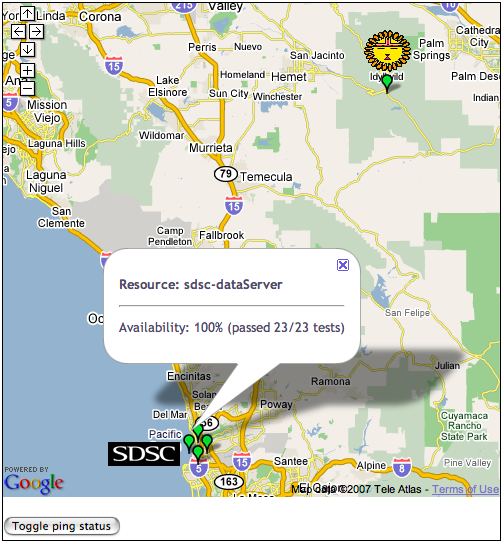
Clicking on the "Toggle ping status" button displays the status of the cross-site ping test as show below.
6.1.2.2. Setting up Google Map View
The Inca map views can be configured using the page described in Section 6.4.2. Use the options in Section 6.1.2.2.1 to configure maps for your site.
Next give the map generator the locations of your resources. Use the configuration page to add/edit sites and resource like the one below:
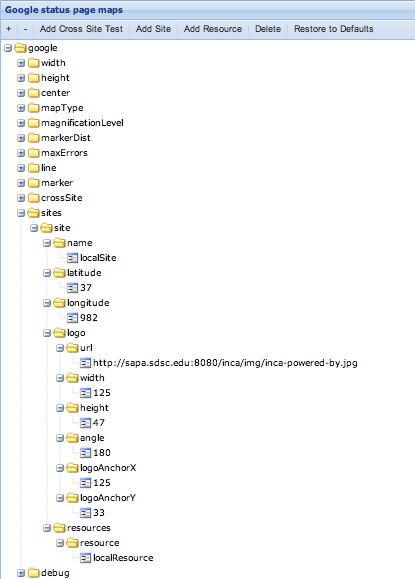
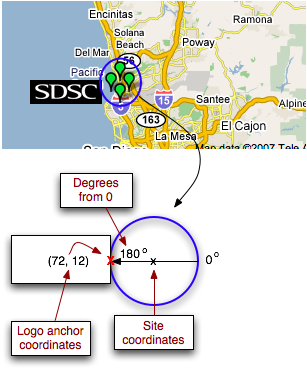
Provide a site name, latitude/longitude coordinates and a list of resources for each site. Optionally, you can also specify a logo for the site. Specify the height and width of the logo in pixels, angle from 0 degrees, and logo anchor coordinates (logoAnchorX/logoAnchorY) as shown in the figure below:
6.1.2.2.1. Google Map Options
width/height: The size of the map graphic (in pixels) that will be generated. By default the map is 800x500.
center: The center of the map in latitude/longitude coordinates. By default, the center of the map corresponds to the center of the U.S.
mapType: Type of map to display. By default the map is google.maps.MapTypeId.TERRAIN.
google.maps.MapTypeId.ROADMAP: displays the default road map view.
google.maps.MapTypeId.SATELLITE: displays Google Earth satellite images.
google.maps.MapTypeId.HYBRID: displays a mixture of normal and satellite views.
google.maps.MapTypeId.TERRAIN: displays a physical map based on terrain information.
magnificationLevel: The initial magnification, or zoom level, of the map expressed as a number between 1 and 12. Zoom level 1 displays the entire world, while zoom level 12 allows you to read street names.
markerDist: The distance between resource markers at a site. If there is more than one resource at a particular site, the resource markers will be arranged in a circle around the site center. By default, the distance between the markers will be determined so that the markers do not overlap each other.
maxErrors: The maximum number of errors to display in the info window that is displayed when a resource is clicked.
line: For cross-site tests, a line will be displayed between the two sites to indicate the test status. If a suite contains a cross-site test, a button will be displayed below the map named "Toggle <testName> status". When the button is clicked, the status of an individual cross-site test will be expressed as a line in between the source resource and the destination resource. The color of the line used to represent the test status can be customized. By default, green represents the test passed and red represents the test failed. See "crossSite" below to specify the tests you want displayed.
marker: Customize the look of the icon marker used to represent a resource on the map. A resource is represented by a Google marker and the color varies based on the number of tests that it failed: all tests passed =
 ,
at least one test failed =
,
at least one test failed =  ,
all tests failed =
,
all tests failed =  .
. Suppose you wanted to change the icons displayed to weather icons so that all tests passed =
 ,
at least one test failed =
,
at least one test failed =  ,
all tests failed =
,
all tests failed =  . You would
first find the size of the icons and modify the iconWidth and iconHeight (in this case the weather icons are 32x32 pixels).
Then pick the anchor point for the icon to be placed in relation to the resource's place on the map. Since we want the middle of the icon to be placed on the map, we choose the coordinates (16, 16) and modify iconAnchorCoord.
Next determine the anchor point for the info window to pop up relative to the icon. Since we want the info window to appear in the top middle, we choose the coordinates (16, 10) and modify iconInfoWindowAnchorCoord. Then construct the icon URLs
using the three weather icons located on the Google server at: http://maps.google.com/mapfiles/kml/pal4/icon33.png, http://maps.google.com/mapfiles/kml/pal4/icon34.png, http://maps.google.com/mapfiles/kml/pal4/icon36.png. Set the following values: iconUrlPrefix="http://maps.google.com/mapfiles/kml/pal4/icon", iconStatus->fail="36", iconStatus->pass="33", iconStatus->warn="34", iconUrlSuffix=".png".
Finally, specify the url for the shadow icon by setting shadowIconUrl="http://maps.google.com/mapfiles/kml/pal4/icon36s.png".
. You would
first find the size of the icons and modify the iconWidth and iconHeight (in this case the weather icons are 32x32 pixels).
Then pick the anchor point for the icon to be placed in relation to the resource's place on the map. Since we want the middle of the icon to be placed on the map, we choose the coordinates (16, 16) and modify iconAnchorCoord.
Next determine the anchor point for the info window to pop up relative to the icon. Since we want the info window to appear in the top middle, we choose the coordinates (16, 10) and modify iconInfoWindowAnchorCoord. Then construct the icon URLs
using the three weather icons located on the Google server at: http://maps.google.com/mapfiles/kml/pal4/icon33.png, http://maps.google.com/mapfiles/kml/pal4/icon34.png, http://maps.google.com/mapfiles/kml/pal4/icon36.png. Set the following values: iconUrlPrefix="http://maps.google.com/mapfiles/kml/pal4/icon", iconStatus->fail="36", iconStatus->pass="33", iconStatus->warn="34", iconUrlSuffix=".png".
Finally, specify the url for the shadow icon by setting shadowIconUrl="http://maps.google.com/mapfiles/kml/pal4/icon36s.png".iconWidth/iconHeight: size of icon in pixels.
iconAnchorCoord: the coordinates of point inside the icon to be used for the anchor.
iconInfoWindowAnchorCoord: where the anchor point for the info window should appear inside the icon.
iconUrlPrefix/iconStatus/iconUrlSuffix: set of 3 icons to indicate the different resource status: pass/fail/warn based on the number of tests the resource passes. The url for the 3 different images should have the same url pattern constructed by concatenating <iconUrlPrefix>, <iconStatus>/<fail|pass|warn>, and <iconUrlSuffix>.
shadowIconUrl: url of a icon to use for the shadow of the resource icon.
shadowIconWidth/shadowIconHeight: the size of the shadow icon in pixels.
crossSite: For each cross site test specified, a button will be displayed under the map to toggle status lines on and off the map. Each test has a name and a regex (regular expression to match the cross site test nicknames).
sites: The information about where to place resources in a site. Can have multiple logos and resources for a site. The logo angle/logoAnchorX/logoAnchorY are placement relative to the latitude/longitude. Angle is the degrees from the site center (latitude/longitude). For example, an angle of 0 will place the logo to the right of the resources, 180 to the left, 90 to the top, and 270 to the bottom. logoAnchorX and logoAnchorY are used to indicate the coordinates relative to the image that should be placed on the map. For example, if your image is 12x12, using logoAnchorX=6 and logoAnchorY=6 will place the image in the center.
debug: For development purposes. Will print out some log messages in a javascript window if greater than 0.
6.1.2.3. Accessing the Google Map View
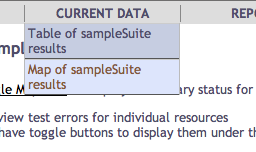
Once setup is complete, load the map view by selecting the "Map of sampleSuite results" item of the CURRENT DATA menu in the navigation bar.
In the default installation, this links to http://localhost:8080/inca/jsp/status.jsp?xsl=google.xsl&xml=google.xml&suiteNames=sampleSuite&resourceIds=defaultGrid. This shows one resource and the Inca logo, similar to the map below. The resource status for multiple suites can be shown by editing header.xsl to provide comma-delimited lists for status.jsp's suiteNames and resourceIds parameters.
Clicking on the resource marker will display an info box as below. Clicking on the name of any failed test will take you to the reporter details page.
6.2. Reports
The items in the REPORTS menu display graphic reports of current Inca data and series histories. These graphs are generated using Cewolf, a JSP tag library for graphing based on JFreeChart. Some reports require the "incaQueryStatus" query to have run previously; information about queries can be found in Section 6.3.3.
6.2.1. Pass/Fail Graphs and Error Messages
The first item in the REPORTS menu executes report.jsp, which uses CeWolf/JfreeChart, to generate historical summary reports with pass/fail status and error information.
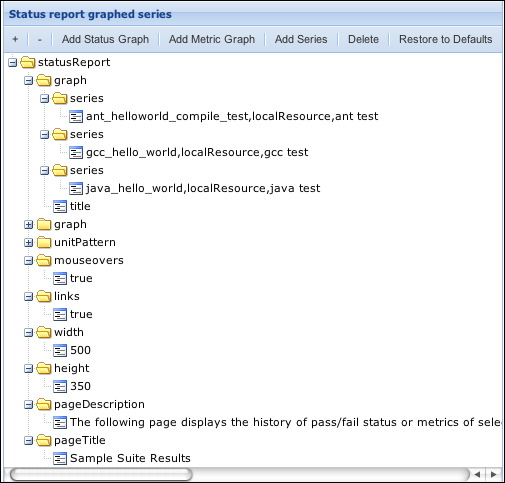
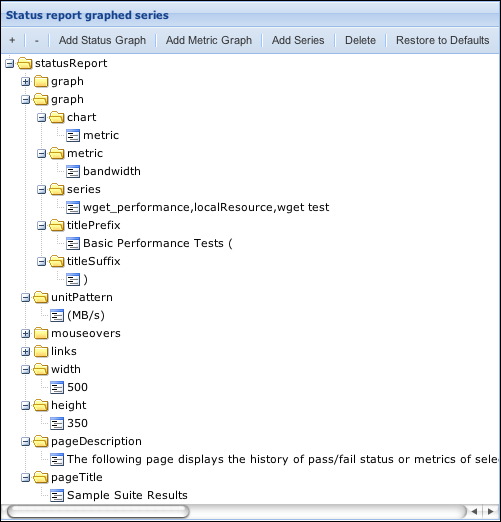
The graphed series can be customized using the page described in Section 6.4.2. Each "graph" folder represents a separate graph on the page and the series under it will appear in the graph. Series should be entered in the format "nickname,resource,label" and correspond to the names and resources of committed series. Each graph has its own title. The height and width of all the graphs can also be customized as well as the page description and title.
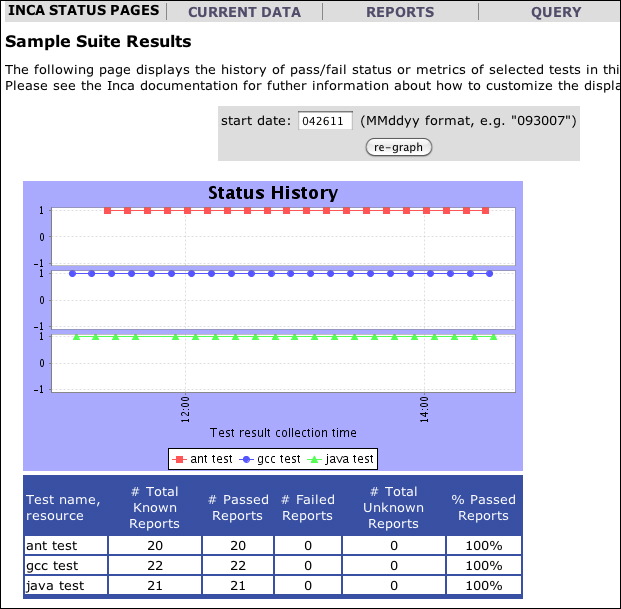
The default consumer groups different combinations of sampleSuite series and displays the past week of results. Each set of series has a title (e.g., Software Deployment Tests) for its grouping and the series nickname, resource name, and report label for each series in the group.
6.2.2. Metric Reports
Like above, the first item in the REPORTS menu executes report.jsp, which uses CeWolf/JfreeChart, to also generate historical summary reports graphing one or more metrics.
The graphed series can be customized using the page described in Section 6.4.2. Each "graph" folder represents a separate graph on the page and the series under it will appear in the graph. Series should be entered in the format "nickname,resource,label" and correspond to the names and resources of committed series. The default consumer graphs a single metric called 'bandwidth' for the series "wget_performance,localResource,wget test". Additional metrics can be specified as a comma separated list, e.g., "EP-STREAM_Triad_GB_s,G-STREAM_Triad_GB_s,Wall_Mins".
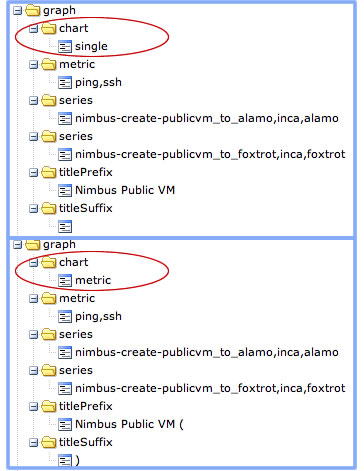
There are three different chart types that can be specified as defined below. By default, the chart type will be 'metric'.
metric: one graph containing all series will be printed per metric
series: one graph containing all metrics will be printed per series
single: all series and metrics will display on a single graph
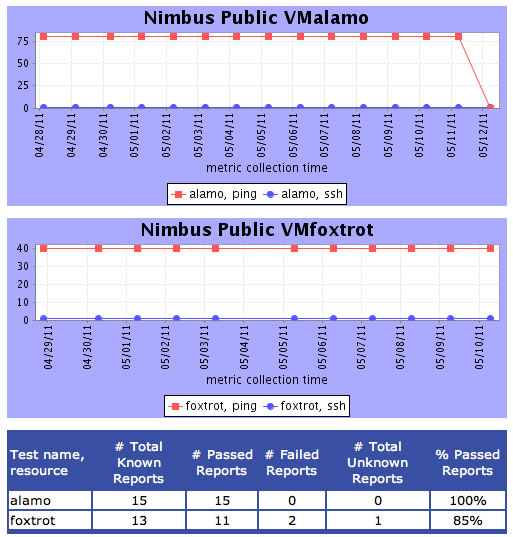
Below is the graph configuration for two series, one connecting to the alamo resource and the other to the foxtrot resource. Each series collects two metrics - ping and ssh. There are two graphs that are identically configured except that the first one uses the "single" chart type so that all series and metrics are graphed together, and the second uses the "metric" chart type so that the ssh and ping metrics are graphed separately.
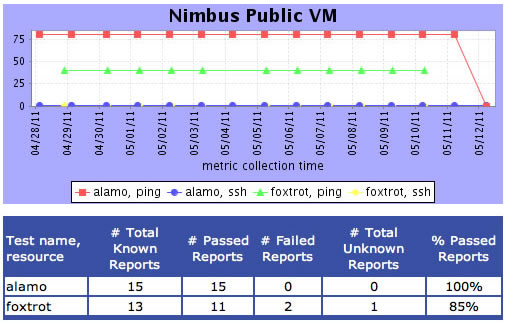
The graphs created by the configuration above are shown below. The first graph uses the chart type "single" so we see four lines, one for each series and one for each metric:
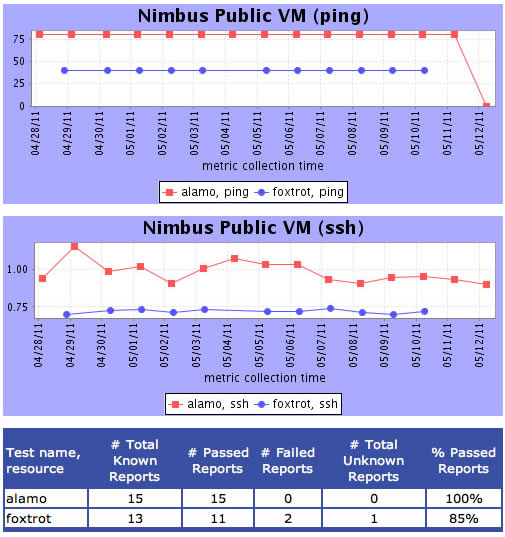
The second configuration uses the chart type "metric" so there are two graphs, one for each metric. Each graph has two lines, one for each series:
If configuration used the chart type "series" there would be two graphs, one for each series. Each graph would have two lines, one for each metric:
6.2.3. Average Pass Rate by Resource/Suite
The second item in the REPORTS menu executes summary.jsp, which uses CeWolf/JfreeChart and stylesheets seriesAverages.xsl and periodAverages.xsl to show the average series pass rate by resource and suite for the past week. Each bar label shows the value of the average series pass rate for the last week and the difference in percentage from the previous week. The color is green if the average pass rate is better than the previous week, red if the average pass rate is worse, and gray if there was no change. Individual bars can be clicked on to show the percentages broken down further for each individual resource or suite.
Click on any bar to view a more detailed report for that resource or suite. For example, clicking on the bar for the 'app-support.teragrid.org-4.0.0' suite above shows the average pass rates for the 'app-support.teragrid.org-4.0.0' suite for each resource (figure below).
6.2.4. Series Error Summary
The third item in the REPORTS menu executes status.jsp with seriesSummary.xsl to summarize test series errors by time period. Each time period includes the number of errors for the series during the time period, the number of unique or distinct errors during the period, and the percentage of the total results that passed during the period.
The time periods and titles (i.e., PAST 4 WEEKS) can be customized using the page described in Section 6.4.2.
The change between the total number of errors in the most recent period and the total number of errors in the period before it is also given. If the number of errors in the most recent period is greater than the number of errors in the previous period (+), the number appears in red. If the number of errors in the most recent period is less than the number in the previous period (-), the number is green.
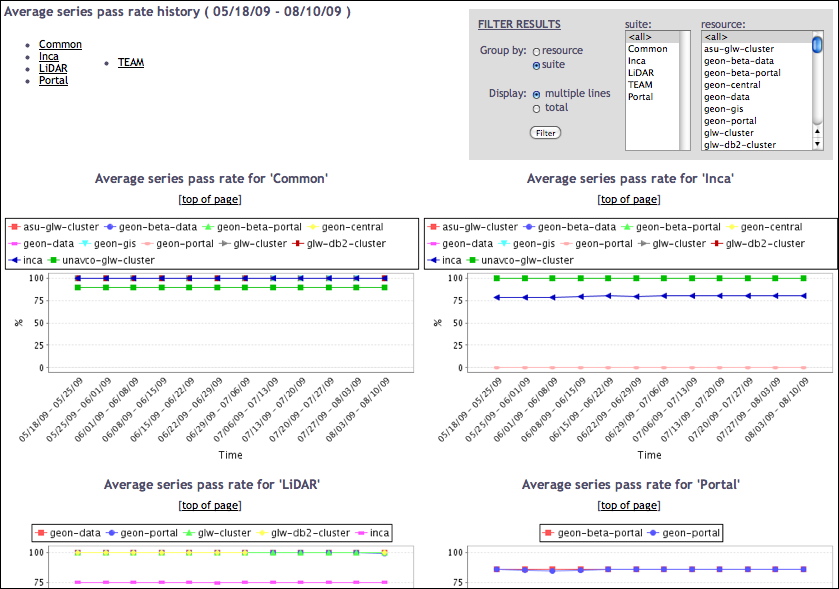
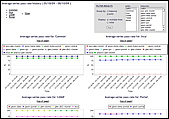
6.2.5. Average Pass History
The fourth and fifth items in the REPORTS menu execute summaryHistory.jsp, which uses CeWolf/JfreeChart and stylesheets seriesAverages.xsl and periodAverages.xsl to show the average series pass rate over time grouped by resource and suite. I.e., When grouped by suite, a history graph summarizing the average series pass rate is displayed for each suite. By default, multiple lines are used to show the summary history on each resource. To view the total summary history percentages for all resources, click the total checkbox in the top right corner and click the 'Filter' button. Histories for either specific resources or suites can also be displayed thru the form in the top right corner. The amount of history shown is 4 weeks by default but can be modified by editing the 'incaQueryStatus' query parameters described in Section 6.3.3.
6.3. Query
The query pages allow users to generate graphs and cache queries to improve data display.
6.3.1. Create Graph
The first item of the QUERY menu executes status.jsp with graph.xsl to create a form that allows you to graph the history of more than one series. The form allows you select the set of series of interest via a set of checkboxes.
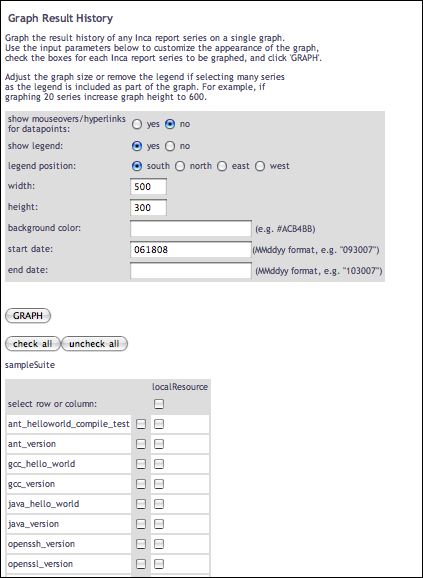
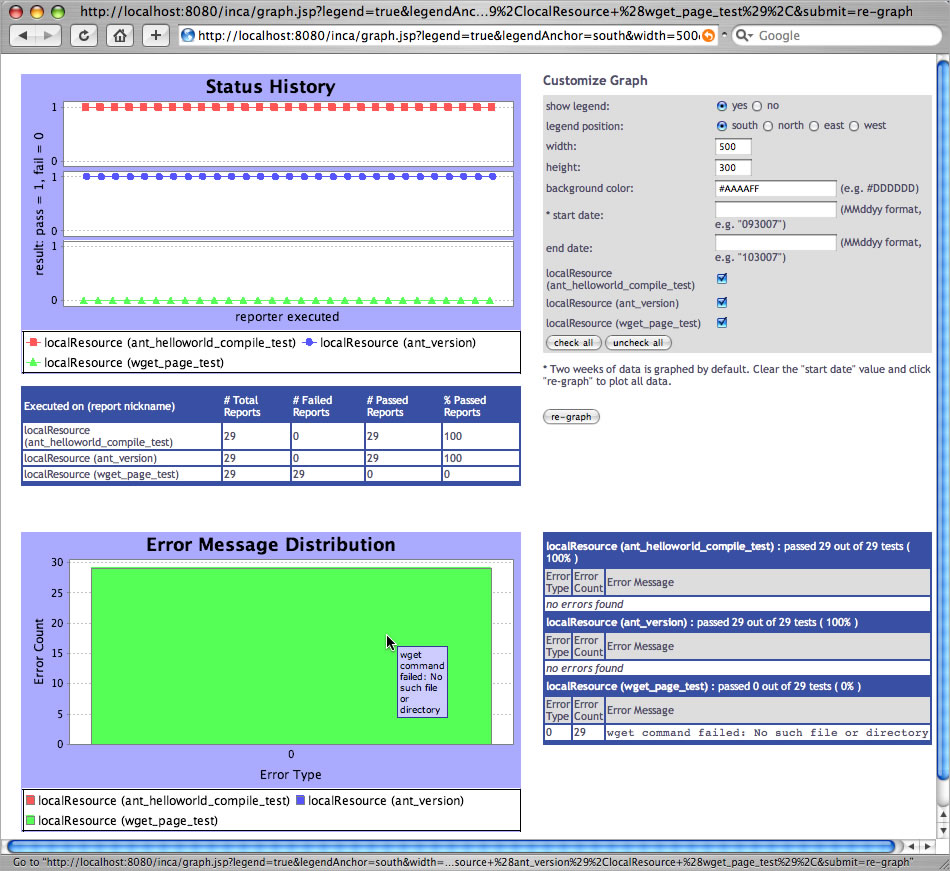
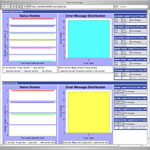
After selecting the "vtk-nvgl_version" series and clicking on the "graph" button in the form above, a graph page similar to the one below is shown with an XY plot of the pass/fail status of the selected series, a series pass/fail summary table, a bar graph of error message frequency (if the selected series have errors), a summary table of error messages, and a form to customize the graph further.
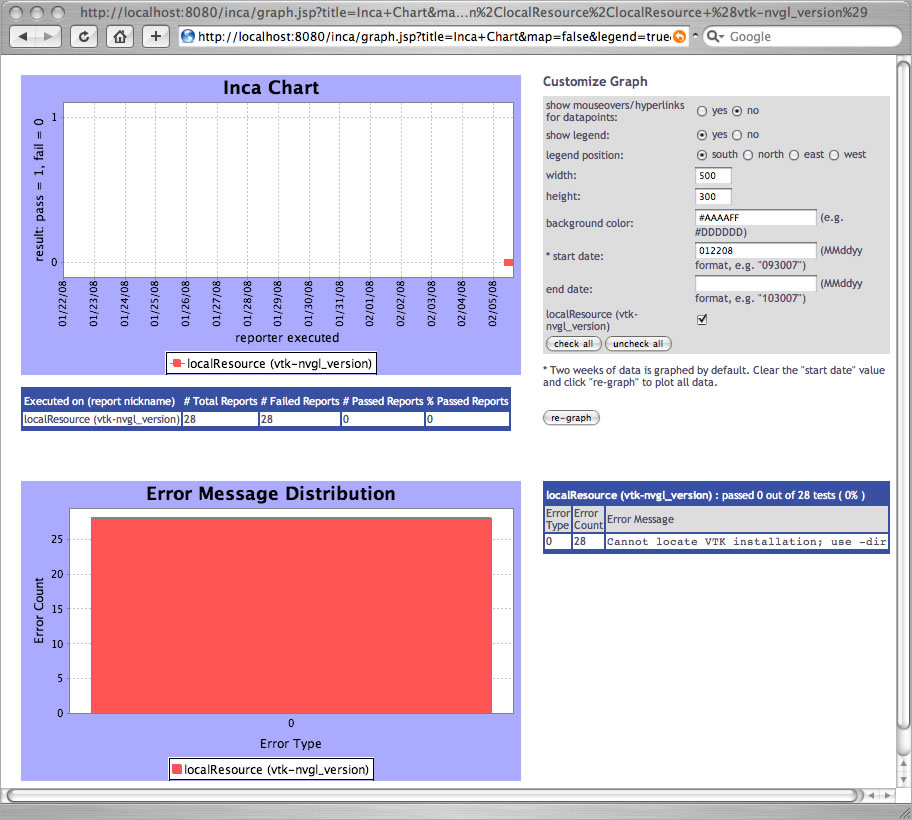
To query for all results, clear the "start date" field in the "customize graph" section and click "re-graph". To retrieve graphs more quickly, data point mouseover text and links to report details are turned off for the pass/fail graph. The data points can be made interactive by choosing "show mouseovers/hyperlinks" in the "customize graph" section and clicking on "re-graph". Clicking on interactive data points will lead to report details pages, mousing over them will show collection times and any error messages.

Multiple series can also be graphed together as in the image below. A table under each graph summarizes results for each series.
Graph pages for individual series are also linked from the report details pages.
6.3.2. Create Stored Query
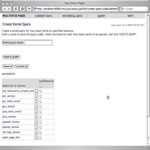
The second item in the QUERY menu executes status.jsp with create-query.xsl to provide a form for creating a cached query. Unless password protection has been disabled as described in Section 6.15, selecting this item causes the consumer to prompt for an id and password. The consumer can cache frequently executed depot queries in order to improve data display speed. For example, the latest results for a suite can be cached in order to quickly display a suite status page. By default the latest results for the sampleSuite are cached every 2 minutes. Results are also cached each day for historical reports.
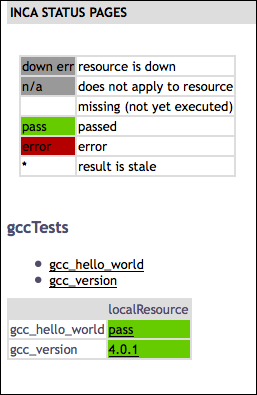
Cached queries can be used to display custom tables of latest results, using the queryNames parameter to status.jsp For example, the image below shows the creation of a cached query, named gccTests, for two series in the default installation.
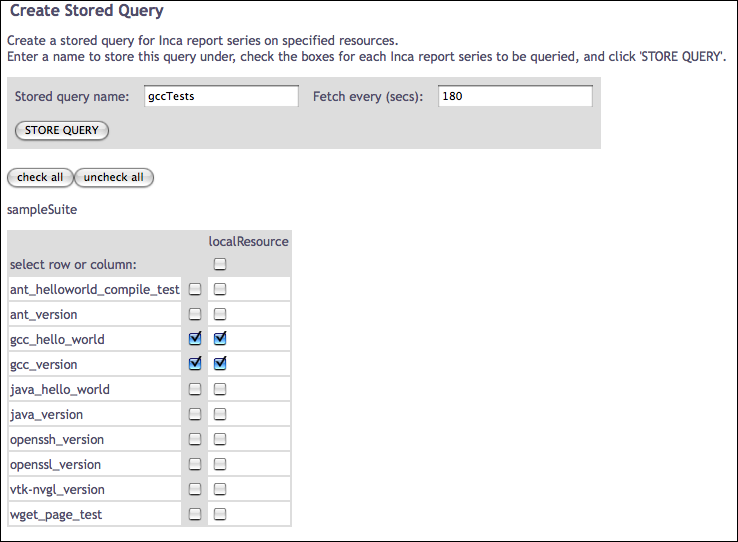
Once this query has been stored and executed, the table shown below can be viewed via http://localhost:8080/inca/jsp/status.jsp?queryNames=gccTests&resourceIds=defaultGrid
6.3.3. Manage Stored Queries
The third item in the QUERY menu executes query.jsp to allow management of cached queries. Unless password protection has been disabled as described in Section 6.15, selecting this item causes the consumer to prompt for an id and password. Click on one of the pre-defined queries to see its parameters. Each query has a name, execution schedule, depot command it executes and the parameters for the depot command executed.
By default, the latest instances of all suites are cached every 2 minutes by predefined queries named incaQueryLatest+agentUri_suiteName. These cached queries are used for the CURRENT DATA menu views described in Section 6.1. Another default query is "incaQueryStatus" which retrieves a summary of the number of successes and failures for each series for the past 4 weeks. This cached query is used for the several of the reports described in Section 6.2. To display 10 weeks of history instead, modify "28" days to "70" and click "Change". Note that the consumer will automatically re-create any of these default queries that are deleted.
6.4. Admin
The ADMIN menu item offers two views of the running reporters in an Inca deployment and a configuration page. To link other informational pages under this heading, customize the header.xsl file as described in Section 6.9.3.
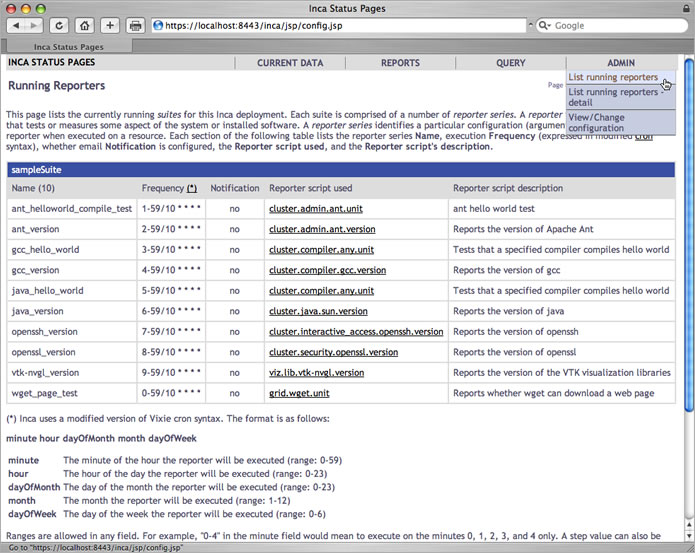
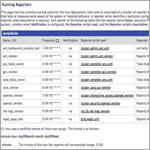
6.4.1. List Running Reporters
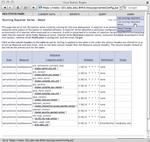
The "Running Reporters" page displays running reporters series by suite. Each series lists its name, frequency of execution, whether email notification is enabled, the reporter script used for the series, and a description of the reporter script. Note that in this view, and in the more detailed running reporters view, the reporter names link to a CGI script that will not work for repositories that are not web accessible (like the local default repository). Make your repository web accessible and add/commit the repository URL beginning with "http" in order to activate the reporter links.
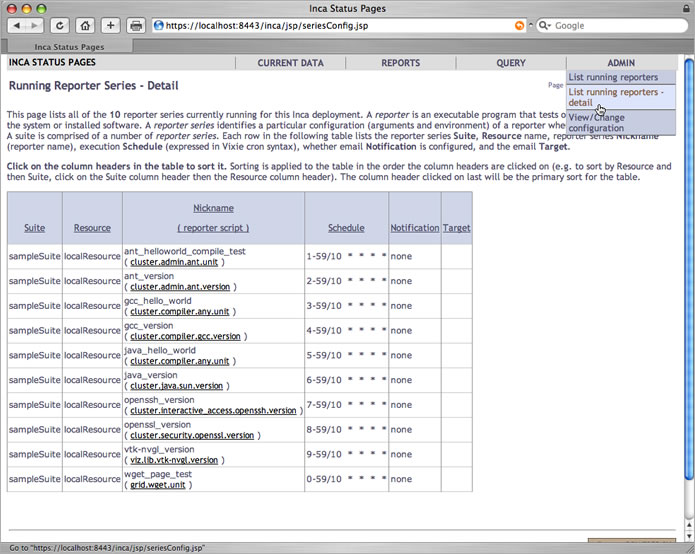
The detailed "Running Reporter Series" page below lists the running reporter series and the suite each belongs to, the machine each is scheduled to execute on, whether email notification is configured, and the recipient ("Target") of any notification.
6.4.2. View/Change Configuration
Here Inca administrators can view and change the global configuration of status pages. Determine whether to allow run nows or the execution of tests via the detailed status pages (see Section 6.5.1) and configure the knowledge base, google map, series summary and status report status pages.
6.5. Report Details
The Current Data, Reports, and Query views described in previous sections provide links to a view that displays the individual report details as shown in the figure below.
6.5.1. Run Nows
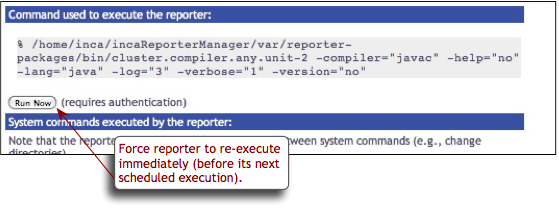
If the "Allow run nows from web pages" option is checked (see Section 6.4.2), a "Run Now" button will appear under the "Command used to execute the reporter" heading. This option is useful for system administrators who have fixed an issue and want to see the updated result or for those who want to verify that a problem has been resolved.
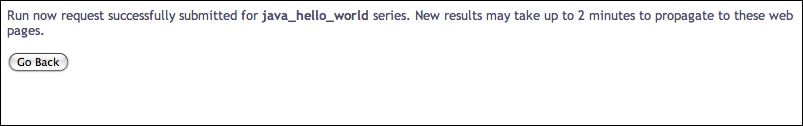
Clicking on the "Run Now" button triggers reporter execution on the local machine. Depending on the reporter execution time and page cache frequency (see Section 6.3.3), results may take a few minutes to propagate to the Inca web pages.
Since authentication is required based on the authentication setup (see Section 6.15), a box will popup such as follows:
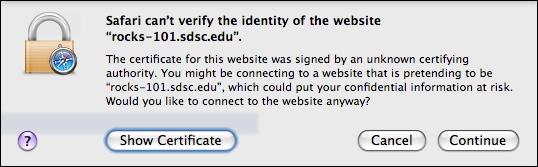
Press 'Continue' and the security login window will display such as follows:
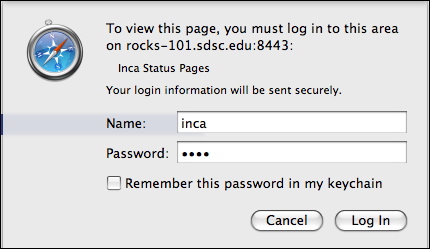
Use the username and password specified in $INCA_DIST/etc/realm.properties. By default, the username and password are 'inca'. After the consumer submits the request, you will see a confirmation such as below:
6.5.2. Knowledge Base
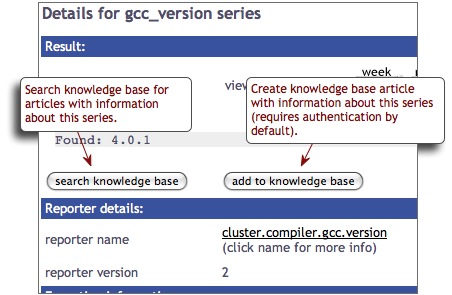
The Inca default knowledge base is designed to collect problem resolution information for tests. System administrators may use solutions stored in the knowledge base when debugging issues on their resources. The knowledge base can be configured using the admin page described in Section 6.4.2 with the options described after the configuration image below:
enable:
If the "enable" value is set to "true" then a "search knowledge base" button and an "add to knowledge base" button will appear under the "Result" heading of the reporter details status pages. If "enable" is set to "false" then the knowledge base buttons will be hidden and inaccessible.
searchString:
The URL that will be visited after clicking on the "search knowledge base" button. The macros "@nickname@", "@reporter@" and "@error@" will be replaced by the actual series nickname (e.g. gcc_version), reporter name (e.g. cluster.compiler.gcc.version), and error message for each test. The "+" character will be replaced by "&".
submitString:
The URL that will be visited after clicking on the "add to knowledge base" button. The macros "@nickname@", "@reporter@" and "@error@" will be replaced by the actual series nickname (e.g. gcc_version), reporter name (e.g. cluster.compiler.gcc.version), and error message for each test. The "+" character will be replaced by "&".
submitEmailNotification:
The email address to send new, changed, and removed knowledge base articles to. By default no email notifications are sent and the "submitEmailNotifications" value is set to "none". To add email notifications, change this value to an email address or a list of email addresses separated by commas (e.g. "email1@loc.edu, email2@loc.edu").
Once the knowledge base is enabled, two buttons to search and add to the knowledge base will appear on the report details pages:
Clicking on the "search knowledge base" button will lead to the URL set as the "searchString" value. By default, this returns all of the knowledge base articles related to the series:
Clicking on the "add to knowledge base" button will lead to the URL set as the "submitString" value. By default, this is a form for entering article information. Since authentication is required for this form based on the authentication setup (see Section 6.15), a box will popup such as follows:
Press 'Continue' and the security login window will display such as follows:
Use the username and password specified in $INCA_DIST/etc/realm.properties. By default, the username and password are 'inca'. After the consumer submits the request, a form will appear to complete like the one below:
6.5.2.1. Using an External or Custom Knowledge Base
To use an external or custom knowledge base instead of Inca's default internal knowledge base, configure the "searchString" and "submitString" parameters described in Section 6.5.2. For example, to add articles to an external knowledge base with a cgi submission form like
https://www.teragrid.org/cgi-bin/add-kb.cgi?articleText=text
change the "submitString" parameter to something like
https://www.teragrid.org/cgi-bin/add-kb.cgi?articleText=@nickname@%20@error@
Inca will replace the @nickname@ macro with the actual series nickname (e.g. gcc_version) and the @error@ macro with the series error message. The "%20" represents a space since Inca replaces the "+" character with "&". Therefore, if the external knowledge base had a cgi submission form like
https://www.teragrid.org/cgi-bin/add-kb.cgi?articleTitle=title&articleText=text
then the "submitString" parameter would be changed to something like
https://www.teragrid.org/cgi-bin/add-kb.cgi?articleTitle=@nickname@+articleText=@error@
The same syntax applies to the "searchString" parameter, which Inca uses to search for knowledge article and can be an external or custom URL.
6.6. Report Summaries
The Current Data and Query views described in previous sections display "latest" report summaries like the one shown in the figure below.
Report summaries are generated by a depot query that returns the XML described in Section 7.1.1.
6.7. Description of Data Consumer Files
The following table describes the main JSPs contained in the default consumer. The JSPs generally retrieve XML from depot and agent functions and apply XSL stylesheets to display HTML. If the "debug=1" parameter for a JSP is used, the JSP displays the XML. Parameters marked with an asterisk (*) are optional.
Table 2. Default Consumer JSP
Name | Purpose | Parameters | |
|---|---|---|---|
config.jsp
| Prints description of deployed suites and series. Linked at the bottom of index.jsp |
| |
error.jsp
| Prints Inca error message page. |
| |
graph.jsp
| Historical graphs of pass/fail status and error frequency. |
e.g. http://localhost:8080/inca/jsp/graph.jsp?series=ant_helloworld_compile_test,localResource | |
index.jsp
| Lists an installation's configured suites and resource names in an HTML form whose action is to display results for the selected suite and resource. The consumer initially redirects to this page. |
| |
instance.jsp
| Queries depot for report instance and invokes the specified xsl stylesheet on it. |
| |
query.jsp
| Page for managing stored queries in the Consumer. Queries can be added, deleted, changed, viewed or executed (and return XML). This jsp page manages the query manipulation via jsp tags and leaves the display of the current queries to a stylesheet. |
| |
report.jsp
| Summary report with graphs of pass/fail status and error frequency. |
| |
seriesConfig.jsp
| Prints detailed (expanded) information about running reporter series. Linked in ADMIN menu. |
| |
status.jsp
| Displays current results for a set of suites or cached queries. This page is the action of the index.jsp form to display suite results. |
e.g. http://localhost:8080/inca/jsp/status.jsp?suiteNames=sampleSuite&resourceIds=defaultGrid | |
summary.jsp
| Shows the average series pass rate by resource and by suite for a given time period. Uses seriesAverages.xsl and periodAverages.xsl to calculate statistics. | ||
summaryDetails.jsp
| Displays summary statistic details for resource or suite. Linked from summary.jsp. Uses seriesAverages.xsl and periodAverages.xsl to calculate statistics. |
e.g. http://localhost:8080/inca/jsp/summaryDetails.jsp?resource=localResource | |
summaryHistory.jsp
| Displays average series pass rate by resource or suite. Uses seriesAverages.xsl and periodAverages.xsl to calculate statistics. |
e.g. http://localhost:8080/inca/jsp/summaryHistory.jsp?groupBy=resource |

The default JSPs use the XSL stylesheets in $INCA_DIST/webapps/xsl to transform the XML into HTML. The following stylesheets are installed with the default consumer:
Table 3. Default Consumer XSL
Name | Applied To | Purpose |
|---|---|---|
config.xsl
| config.jsp | Prints description of deployed suites and series. |
create-query.xsl
| status.jsp | Prints form to select series and resources to query. |
default.xsl
| status.jsp | Prints table of suite(s) results. |
error.xsl
| error.jsp | Displays JSP error message and usage information. |
footer.xsl
| (included in most other xsl files) | Prints HTML page footer with the Inca logo. |
google.xsl
| status.jsp | Prints google map summary of current data. |
graph.xsl
| status.jsp | Prints form to select series to graph. |
header.xsl
| (included in most other xsl files) | Prints HTML page header. |
inca-common.xsl | (included in most other stylesheets) | Common templates for use in Inca stylesheets. |
index.xsl
| index.jsp | Lists all configured suite and resource names in an HTML form whose action is to display results for the selected suite and resource. |
instance.xsl
| instance.jsp | Prints HTML table with report details. |
legend.xsl
| (included in default.xsl and swStack.xsl) | Prints a key to cell colors and text. |
periodAverages.xsl
| summary.jsp, summaryDetails.jsp, summaryHistory.jsp | Computes pass percentage for suites and resources for a given period. |
query.xsl
| query.jsp | Creates form to manipulate hql queries. |
seriesAverages.xsl
| summary.jsp, summaryDetails.jsp, summaryHistory.jsp | Computes series pass percentages. |
seriesSummary.xsl
| status.jsp | Print out a table of stats for individual series. |
swStack.xsl
| status.jsp | Prints table of suite(s) results. Uses XML file to format table rows by software categories and packages. |


6.8. REST URLs
Inca provides the ability to fetch suite or stored query data in XML or HTML format using REST URLs. By default, the consumer recognizes a REST URL using the following format:
http://localhost:8080/inca/XML|HTML/rest/<suiteName>|<queryName>[/<resourceId>[/<seriesNickname>[/<timestamp>|week|month|quarter|year]]]
Table 4. Examples of Inca REST URLs
REST URL (Equivalent URL shown under REST URL) | Returns |
|---|---|
http://localhost:8080/inca/HTML/rest/sampleSuite equivalent to: http://localhost:8080/inca/jsp/status.jsp?suiteNames=sampleSuite | An HTML table of latest results for the specified suite (or query). Generated by applying an XSL stylesheet to an array of report summaries.
|
http://localhost:8080/inca/HTML/rest/sampleSuite/defaultGrid equivalent to: http://localhost:8080/inca/jsp/status.jsp?suiteNames=sampleSuite&resourceIds=defaultGrid | An HTML table of latest results for the specified suite and resource. Generated by applying an XSL stylesheet to an array of report summaries.
|
http://localhost:8080/inca/HTML/rest/sampleSuite/localResource/ant_version equivalent to: http://localhost:8080/inca/jsp/instance.jsp?nickname=ant_version&resource=localResource&collected=2010-06-14T12:52:00.000-07:00 (collected param would vary) | An HTML table of the *latest* report details for the specified suite, resource and series.
|
equivalent to: | An HTML table of the report details for the specified suite, resource, series and timestamp.
|
http://localhost:8080/inca/HTML/rest/sampleSuite/localResource/ant_version/week equivalent to: http://localhost:8080/inca/jsp/graph.jsp?series=ant_helloworld_compile_test,localResource&startDate=060710 (startDate param would vary) | Graph of weekly historical results the specified suite, resource and series (also available for month, quarter or year). Generated by graphing an array of graph instances.
|
If you want to fetch the data in XML, just replace HTML as below:
http://localhost:8080/inca/XML/rest/sampleSuite/localResource
If you would like to change the id 'rest' to a more transparent id such as 'kit-status-v1', edit <context-param> in $INCA_DIST/webapps/inca/WEB-INF/web.xml and restart the consumer. For example, change
      <context-param>
        <param-name>restId</param-name>
        <param-value>rest</param-value>
      </context-param>
|
to
      <context-param>
        <param-name>restId</param-name>
        <param-value>kit-status-v1</param-value>
      </context-param>
|
6.9. Changing the Look
6.9.1. Colors and Fonts
Properties such as colors and fonts are controlled by the default CSS (Cascading Style Sheet) file $INCA_DIST/webapps/inca/css/inca.css. The drop down nav bar in the header is controlled by $INCA_DIST/webapps/inca/css/nav.css. You can edit these files to customize the consumer display. For example, to change the color in the reporter detail pages header bar, edit inca.css and change lines 111-112 to:
.header {
background-color: #D07651; |
For general information, visit the [ CSS tutorial ].
6.9.2. HTML Layout
To modify the default HTML layout, edit the XSL stylesheet that is being applied to the JSP or create a new stylesheet in $INCA_DIST/webapps/inca/xsl and pass it in the JSP "xsl" parameter. The default JSP and XSL files are described in Section 6.7.
For general information about editing stylesheets, visit the [ XSL tutorial ].
6.9.2.1. Custom Values in HTML Table Cells
To display report values other than the default text of either a software version, "pass", or "error" on the suite results pages, edit default.xsl.
For example, to change the default suite status to print the time successful reporters ran and a truncated error message for failures like:
Edit default.xsl, add a new variable for the custom table cell text and print the custom cell text rather than the default text:
188 <xsl:variable name="cellText">
189 <xsl:choose>
190 <xsl:when test="string($instance)=''">
191 <xsl:value-of select="''" />
192 </xsl:when>
193 <xsl:when test="string($result/body)!=''
194 and string($result/errorMessage)=''
195 and ($comparitor='Success' or count($comparitor)=0)">
196 passed:�
197 <!-- get yyyy-mm-dd from gmt timestamp -->
198 <xsl:value-of select="substring($result/gmt, 1, 10)" />�
199 <!-- get HH:MM from gmt timestamp -->
200 <xsl:value-of select="substring($result/gmt, 12, 5)" />
201 </xsl:when>
202 <xsl:otherwise>
203 error:
204 <xsl:value-of select="substring($result/errorMessage, 1, 30)" />
205 </xsl:otherwise>
206 </xsl:choose>
207 </xsl:variable>
208 <xsl:choose>
209 <xsl:when test="$exit!=''">
210 <td class="{$exit}">
211 <a href="{$href}"><xsl:value-of select="$cellText"/></a>
212 <xsl:if test="$url[matches(., 'markOld')]"> |
6.9.3. Custom Page Header
The default page header is generated by the inclusion of the header.xsl file in other xsl files. The header is a navigation bar with drop down links to a set of default status pages:
The header's navigation bar is an HTML unordered list that is formatted with the nav.css stylesheet. To add or remove links in the navigation bar, open header.xsl and change the appropriate link. For example, to show a table of suite results for a new suite called "newSuite" on a new resource called "newResource":
57 <li><h2>Current Data</h2> 58 <ul> 59 <li> 60 <a href="'status.jsp?xsl=default.xsl&suiteNames=newSuite&resourceIds=newResource'"> 61 table of newSuite results</a> 62 </li> |
Any other link can be added or removed as a list element. The stylesheet supports additional levels of nested list links. Note that the top level list elements are displayed from bottom to top (i.e., CURRENT DATA is listed last in header.xsl so it is displayed the furthest left in the top level navigation bar).
Another example of customizing the HTML header would be to add a call to a custom header stylesheet in the "printBodyTitle" template. Edit inca-common.xsl:
13  <xsl:include href="custom-header.xsl"/>
          ...
          24  <xsl:template name="printBodyTitle">
          25    <xsl:param name="title"/>
          26    <xsl:call-template name="custom-header"/>
          27    <xsl:variable name="datenow" select="date:new()" />
          28    <xsl:variable name="dateformat" select="sdf:new('MM-dd-yyyy hh:mm a (z)')"/>
          29    <table width="100%" border="0">
30 <tr align="left"> |
Create a $INCA_DIST/webapps/xsl/custom-header.xsl like:
<?xml version="1.0" encoding="UTF-8"?>

          <!-- ================================================ -->
          <!-- Prints out custom header for Inca status pages   -->
          <!-- ================================================ -->
          <xsl:stylesheet version="1.0"
          xmlns:xsl="http://www.w3.org/1999/XSL/Transform"
          xmlns="http://www.w3.org/1999/xhtml">

          <xsl:template name="custom-header">
          <table class="header" width="100%">
          <tr>
          <td bgcolor="#003366">
          <img class="logo" src="img/header.jpg"/>
          </td>
          </tr>
          </table>
          <table class="menu" width="100%">
          ... custom navigation ...
          </table>
          </xsl:template>

</xsl:stylesheet> |
The resulting page would look something like:
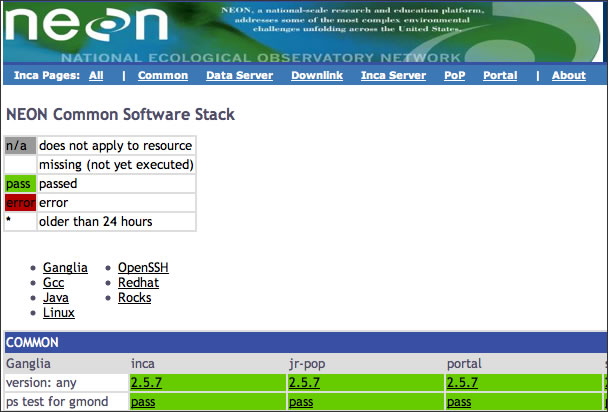
6.10. Displaying Errors Neutrally
You may wish to display certain errors neutrally in historical reports. For example, if an error message indicates that a machine was down when the report was collected, you may want to display that error neutrally (i.e. neither as a pass nor a fail). By default, Inca marks error messages that start with "DOWNTIME" or "NOT_AT_FAULT" neutrally because they are generally the result of report filtering (see Section 11.3). Errors that contain "Inca error" or "Unable to fetch proxy for reporter execution" are also marked neutrally since the error may be due to the Inca framework instead of the machine being tested. To change the errors that are marked neutrally, edit the regular expression that is matched as follows:
Open the $INCA_DIST/etc/common/inca.properties local file and edit the inca.consumer.ignoreErrors property:
inca.consumer.ignoreErrors=(^DOWNTIME:.*|^NOT_AT_FAULT.*|.*Inca error.*|.*Unable to fetch proxy for reporter execution.*)
Restart the consumer:
% cd $INCA_DIST; ./bin/inca restart consumer
Now error messages matching the pattern you chose will be marked neutrally. For example, the four reports that have error messages that begin with "NOT_AT_FAULT" are marked neutrally as "unknown" in the graph below:
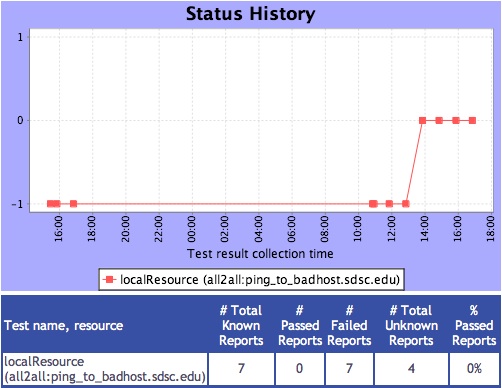
6.11. Changing the Installation Location
You can install the data consumer in a non-default location (e.g., on a machine where the depot and agent are not running) if you:
Copy the incaInstall.sh script to the machine where the consumer will run.
% wget http://inca.sdsc.edu/releases/2.6/incaInstall.sh
Install consumer on the new machine:
% ./incaInstall.sh $INCA_DIST consumers
Copy the consumer key, certificate, and trusted directory from the machine where the agent/depot are running (orig.machine) to the new machine:
% scp orig.machine:$ORIG_INCA_DIST/etc/consumerkey.pem $INCA_DIST/etc/; \
          scp orig.machine:$ORIG_INCA_DIST/etc/consumercert.pem $INCA_DIST/etc/;
          scp "orig.machine:$ORIG_INCA_DIST/etc/trusted/*" $INCA_DIST/etc/trusted/;
Edit the $INCA_DIST/etc/common/inca.properties local file and specify the full hostname of the machine where the agent and depot are running:
114 inca.consumer.agent=incas://agent.hostname:6323
            ...
            128 inca.consumer.depot=incas://depot.hostname:6324
Start the consumer component on the new machine:
% cd $INCA_DIST; ./bin/inca start consumer
6.12. Changing Ports
By default, the consumer is started on port 8080 (HTTP) and 8443 (HTTPS). To change the port numbers, edit $INCA_DIST/etc/jetty.xml. For example to change the HTTP port to 9080, search for 'SelectChannelConnector' and change the following line:
<Set name="port">8080</Set>
|
to:
<Set name="port">9080</Set>
|
Likewise to change the HTTPS port to 9443, search for 'SslSocketConnector' and change the following line:
<Set name="port">8443</Set>
|
to:
<Set name="port">9443</Set>
|
If you also have the HTTP port enabled, change the confidentialPort tag under its configuration from:
<Set name="confidentialPort">8443</Set>
|
to:
<Set name="confidentialPort">9443</Set>
|
6.13. Disabling HTTP
By default, the consumer is configured as both an HTTP and HTTPS server. To disable HTTP, edit $INCA_DIST/etc/jetty.xml and comment out the section "Add a HTTP listener on port 8080"
      <!-- - - - - - - - - - - - - - - - - - - - - - - - - - - - - - - - - -->
      <!-- Add a HTTP listener on port 8080                                -->
      <!-- - - - - - - - - - - - - - - - - - - - - - - - - - - - - - - - - -->
      <!--
      <Call name="addConnector">
        <Arg>
            <New class="org.mortbay.jetty.nio.SelectChannelConnector">
              <Set name="host"><SystemProperty name="jetty.host" /></Set>
              <Set name="port"><SystemProperty name="jetty.port" default="8080"/></Set>
              <Set name="maxIdleTime">30000</Set>
              <Set name="Acceptors">2</Set>
              <Set name="statsOn">false</Set>
              <Set name="confidentialPort">8443</Set>
        <Set name="lowResourcesConnections">5000</Set>
        <Set name="lowResourcesMaxIdleTime">5000</Set>
            </New>
        </Arg>
      </Call>
      -->
|
Then restart the consumer.
% ./bin/inca restart consumer
|
6.14. Changing HTTPS credential
By default, the HTTPS server will use the credential stored in $INCA_DIST/etc/consumerKeystore. Its DN is "cn=Inca Consumer SSL, o=SDSC, l=San Diego, st=California, c=US". If you'd like to generate a certificate with a different DN, run the keytool command as follows:
% rm -f etc/consumerKeystore
% keytool -keystore etc/consumerKeystore -alias jetty -genkey -keyalg RSA -dname your_DN
|
keytool will prompt you for a keystore password and a key password. You can either make them different or use the same one. If you use the password "consumer", no further changes are needed. Otherwise, you will have to modify <Set name="keyPassword">, <Set name="password">, and <Set name="trustPassword"> in the "Add a HTTPS SSL listener on port 8443" section in $INCA_DIST/etc/jetty.xml. You can either put the password in there in plain text or obfuscate it using Jetty's password utility as follows:
% java -classpath lib/jetty-6.1.7.jar:lib/jetty-util-6.1.7.jar org.mortbay.jetty.security.Password your_password
|
It will output two lines such as follows:
    OBF:1t3b1uh61ugk1t2v
    MD5:482b9f833150f58964b78ddbfa5ab23d
|
Edit $INCA_DIST/etc/jetty.xml and replace the string beginning with OBF in both <Set name="KeyPassword"> and <Set name="Password"> with the string provided by Jetty's password utility:
      <Set name="password">OBF:1v8w1v2h1wg01z0d1z0h1wfy1v1x1v9q</Set>
      <Set name="keyPassword">OBF:1v8w1v2h1wg01z0d1z0h1wfy1v1x1v9q</Set>
      <Set name="trustPassword">OBF:1v8w1v2h1wg01z0d1z0h1wfy1v1x1v9q</Set>
|
6.15. Adding Password Protection
By default, a password is only required on the query.jsp and status-auth.jsp pages. To expand or remove password protection, edit the section 'require authentication on specific status pages' in $INCA_DIST/webapps/inca/WEB-INF/web.xml.
    <security-constraint>
      <web-resource-collection>
        <web-resource-name>Inca Status Pages</web-resource-name>
        <url-pattern>/jsp/admin.jsp</url-pattern>
        <url-pattern>/jsp/query.jsp</url-pattern>
        <url-pattern>/jsp/runNow.jsp</url-pattern>
        <url-pattern>/jsp/status-auth.jsp</url-pattern>
      </web-resource-collection>
      <auth-constraint>
        <role-name>*</role-name>
      </auth-constraint>
      <user-data-constraint>
        <transport-guarantee>CONFIDENTIAL</transport-guarantee>
      </user-data-constraint>
    </security-constraint>
|
Modify or add url-pattern tags to modify password access. For example to apply password access to all Inca status pages, modify the url-pattern tag to below:
        ...
        <url-pattern>/*</url-pattern>
        ...
|
Or to add password protection to another JSP page like config.jsp, add another url-pattern tag like below:
        ...
        <url-pattern>/jsp/query.jsp</url-pattern>
        <url-pattern>/jsp/config.jsp</url-pattern>
        ...
|
By default, the username and password for the pages will be "inca". To change this, edit $INCA_DIST/etc/realm.properties and customize the username and password for your installation. If you do not want to store the password in plain text, use Jetty's password utility described in Section 6.14.
Then restart the consumer.
% ./bin/inca restart consumer |
The next time you view the status pages, you should see a login like:
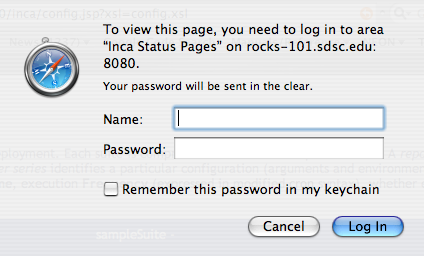
7. Writing Custom Data Consumers
The default Inca consumers described in Section 6.7 are created by fetching XML report data from the Inca depot and applying XSL and JSP to produce HTML tables and graphs. XML can be fetched for specific Inca suites (or stored queries), resources, series and time frames. A number of methods are available for fetching Inca XML: REST URLs, Inca Client APIs, and Web Services. The different types of XML returned from these methods are described in Section 7.1.
Once custom XML is retrieved (see Section 7.2), addtional XSL can be created to display the results according to individual requirements or the XML can be consumed by custom JSPs or other code. Examples of XSL and JSPs are located in the webapps/inca/xsl and webapps/inca/jsp directories respectively. Below are some examples of the way XML can be transformed to produce the basic status pages.
Figure 18 shows an example of XML that is transformed via XSL to produce a pass/fail table of test results. The XML is an array of report summaries, which are the result of querying for a suite or stored query. The exit status or body of each report summary is matched to a resource by the XSL to show the latest result for each resource. If the report summary has a comparison result, it will be used instead of the exit status to determine whether the test passed or failed. Comparison results are checks that are added before the report is stored - one example might be checking whether the software version found in the report was greater than a certain version number.
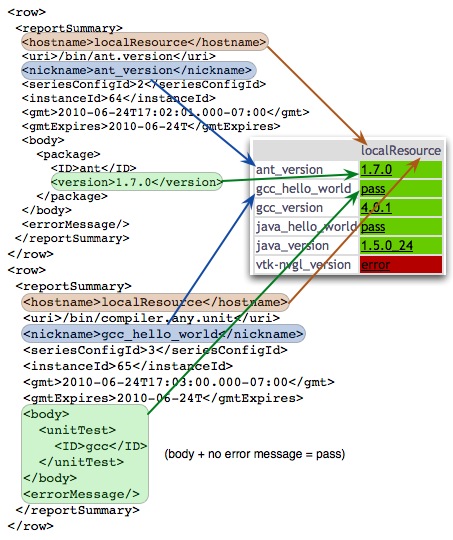
Another consumer example using report summaries XML is shown in Figure 19. Here the XML is transformed via XSL to produce a table of performance results. Like the pass/fail table, the XSL matches results and resources, but here XPath is used to display a statistic in the body instead of a pass/fail exit status.
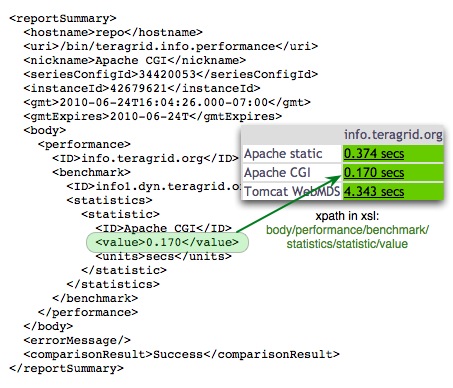
Simple pass/fail graphs are produced by transforming the graph instance XML as shown in Figure 20. The graph is produced by using the exit status values for the y-axis and the collected date values for the x-axis.
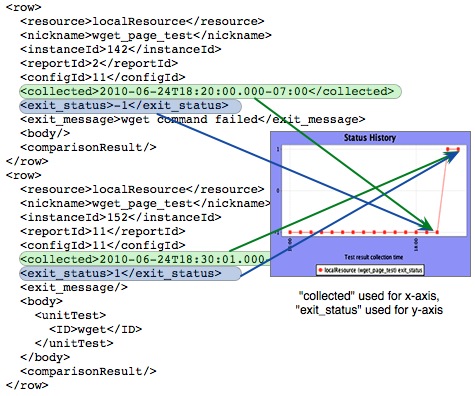
The w3schools site offers an XSL tutorial and an XPath tutorial for more general information about XSL and XPath.
7.1. Understanding Inca XML Data
Inca reporters are executable programs that measure some aspect of the system or installed software. Reporters support a set of command-line options and write XML reports to stdout. The report schema is flexible and can capture multiple types of data.
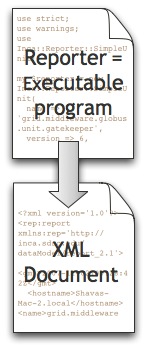
The XML document produced by Inca reporters is called a report and it has a header, body and footer. The header contains metadata, the body contains the data collected by the reporter and has a 4000 character limit, and the footer captures whether the report was successfully gathered or not:
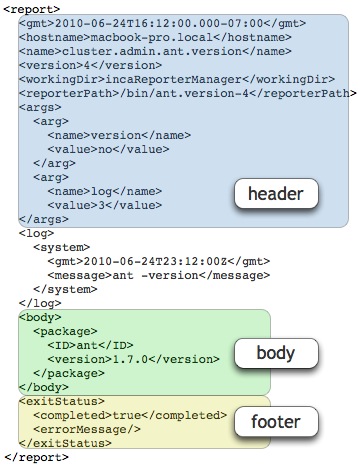
Most of the Inca XML types relate to the basic report type. Some definitions to help understand the XML schemas are:
- report series (or series for short)
set of reports collected at different points in time by executing a reporter with a set of arguments in a context on a particular resource
- series config
used to create the report series and has hostname, args, reporter name/version, schedule, comparitor (extra check to determine pass/fail), and context (optional string used when executing the reporter, e.g. to add a softenv key: "soft add +atlas; cluster.math.atlas.version -args")
- suite
group of series configs that share a common theme, for example data management, job management, or file transfer
- resource group
two or more related resources that share a characteristic like a site, architecture or virtual organization. A resource can be a cluster, supercomputer, or server. The resource group XML is returned along with queries so that they can be matched to test results. Below is a figure to illustrate resource groups:
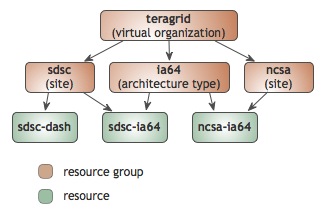
- runtime data
in addition to the main body of data returned by reports, other runtime information is calculated after the report is executed and returned with it. This data includes logged commands, usage information (how much memory, CPU and wallclock time a reporter consumes during execution) and comparison results (extra tests used to calculate whether a test passed or fails, e.g. whether the software version found matches a version requirement)
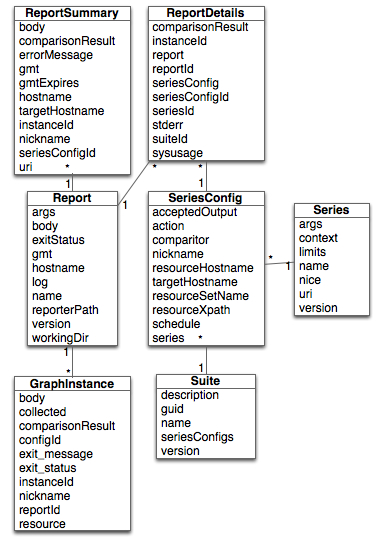
An important concept within Inca is the comparitor. As shown above, every report has an exitStatus to indicate whether an Inca reporter was able to complete successfully or not. For reporters that are more complex, the exitStatus may not be sufficient. For example, a version reporter may successfully collect the version of GCC but the version collected may be too old. Or a performance reporter may successfully collect the bandwidth of a GridFTP transfer but the bandwidth is so low that it could be considered a failure. In these cases, a comparitor can be used to interpret a reporter result. For a version reporter, a simple comparitor would be for example:
gcc >= 4.2 |
For a performance reporter, a simple comparitor would be for example:
bandwidthMB >= 100 |
When a comparitor is specified by an Inca administrator, an additional field, comparisonResult, is returned with the Inca data and contains either a 'Success' or 'Failure:reasons' value. The reason value will be the part of the comparitor that failed, e.g., gcc or bandwidthMB.
A comparitor is also specified when an Inca administrator sets up email notification on a series. Therefore a common comparitor is to check that the errorMessage is empty as shown below:
errorMessage=='' |
If a report with an error is sent to the depot, the errorMessage will be set causing the comparitor to fail and an email notification to be sent.
In summary, when interpreting the result of a report, first check to if a comparisonResult exists. If it does, then use that value. Otherwise, use the body or errorMessage to interpret the result. Please see pseudo-code below for an example:
if ( exists comparisonResult ) {
  if ( comparisonResult == 'Success' ) {
    println "Pass"
  } else {
    println "Failed: " + comparisonResult;
    if ( exists errorMessage ) {
      println errorMessage;
    }
  }
} else {
  if ( body != '' ) { // or you could use if ( errorMessage == '' )
    println "Pass";
  } else {
    println errorMessage;
  }
} |
Below is an example of a series that gets a version of gcc. The series originally has a comparitor that requires a specific version of gcc (>=4.2). The series fails until the comparitor requirement is removed.
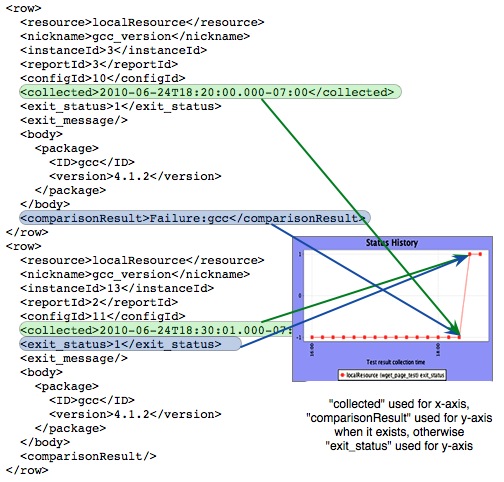
Inca depot query results are formatted as XML, most are an array of reporter execution summary, graph or detail information. These results can be retrieved from the REST, JSP, Client and Web services interfaces described in Section 7.2.
7.1.1. Report Summaries
Report summaries return XML formatted like the following (tags are described below):
<reportSummary xmlns="http://inca.sdsc.edu/queryResult/reportSummary_2.0"> <hostname xmlns="">localResource</hostname> <targetHostname xmlns=""/> <uri xmlns="">file:///Inca-Reporter-5.12450/bin/cluster.compiler.any.unit</uri> <nickname xmlns="">java_hello_world</nickname> <seriesConfigId xmlns="">5</seriesConfigId> <instanceId xmlns="">49</instanceId> <gmt xmlns="">2010-06-08T15:25:01.000-07:00</gmt> <gmtExpires xmlns="">2010-06-08T15:45:01.027-07:00</gmtExpires> <body xmlns=""> <unitTest xmlns:rep="http://inca.sdsc.edu/dataModel/report_2.1"> <ID>javac</ID> </unitTest> </body> <errorMessage xmlns=""/> <comparisonResult xmlns="">Success</comparisonResult> </reportSummary> |
Report summaries use a prefix with a tag name that references the http://inca.sdsc.edu/queryResult/reportSummary_2.0 namespace.
The following tags are defined within query results:
- hostname
resource id where the reporter executed
- targetHostname
resource id of the resource group whose macros were used in configuring the report series. For example, if a reporter executes on resource A, but it uses macros from resource B to get a hostname parameter for the test, the resource id for resource B will be the targetHostname.
- uri
the URI of the reporter repository and the location of the reporter
- nickname
the nickname (short name) for the report series
- seriesConfigId
(internal) the database identifier for the series configuration information for this report summary (used in further queries)
- instanceId
(internal) the database identifier for the instance information for the particular time this report series executed (used in further queries)
- gmt
the time this report series executed (ISO 8601 format)
- gmtExpires
the time when results from this report will become stale (ISO 8601 format)
- body
results of the reporter's testing
- errorMessage
optional string indicating why the reporter failed to complete
- comparisonResult
if series was configured with a comparison, the result of the comparison for this particular report series execution
7.1.2. Graph Instances
Graph instances return XML formatted like the following (tags are described below):
<row> <resource>sapa</resource> <nickname>cvs_repo</nickname> <instanceId>41518967</instanceId> <reportId>20958820</reportId> <configId>20437465</configId> <collected>2010-06-01T00:11:03.000-07:00</collected> <exit_status>0</exit_status> <exit_message/> <body xmlns:rep="http://inca.sdsc.edu/dataModel/report_2.1"/> <comparisonResult>Success</comparisonResult> </row> |
Graph instances use a prefix with a tag name that references the http://inca.sdsc.edu/dataModel/graphSeries_2.0 namespace.
The following tags are defined within query results:
- resource
resource id where the reporter executed
- nickname
the nickname (short name) for the report series
- instanceId
(internal) the database identifier for the instance information for the particular time this report series executed (used in further queries)
- reportId
(internal) the database identifier for the report information for the particular result from this report series (used in further queries)
- configId
(internal) the database identifier for the series configuration information for this report summary (used in further queries)
- collected
the time this report series executed (ISO 8601 format)
- exit_status
boolean indicating whether or not the reporter successfully completed its testing
- exit_message
optional string indicating why the reporter failed to complete
- body
results of the reporter's testing
- comparisonResult
if series was configured with a comparison, the result of the comparison for this particular report series execution
7.1.3. Report Details
The individual report details are generated by a depot query that returns XML formatted like the following (tags are described below):
<reportDetails xmlns="http://inca.sdsc.edu/dataModel/reportDetails_2.1">
  <suiteId xmlns="">8140012</suiteId>
  <seriesConfigId xmlns="">8156370</seriesConfigId>
  <seriesId xmlns="">1712066</seriesId>
  <reportId xmlns="">28430963</reportId>
  <instanceId xmlns="">30977056</instanceId>
  <seriesConfig xmlns="">
    <series>
      <name>cluster.compiler.gcc.version</name>
      <version>2</version>
      <uri>http://inca.sdsc.edu/2.0/ctssv3/bin/cluster.compiler.gcc.version</uri>
      <args>
        <arg>
          <name>log</name>
          <value>5</value>
        </arg>
        <arg>
          <name>version</name>
          <value>no</value>
        </arg>
        <arg>
          <name>help</name>
          <value>no</value>
        </arg>
        <arg>
          <name>verbose</name>
          <value>1</value>
        </arg>
      </args>
      <limits>
        <wallClockTime>600.0</wallClockTime>
        <memory>-1.0</memory>
        <cpuTime>-1.0</cpuTime>
      </limits>
      <context><![CDATA[bash -l -c 'set -a; cd /usr/users/9/inca/inca2install; export PERL5LIB=/usr/users/9/inca/inca2install/var/reporter-packages/lib/perl:${HOME}/inca/install/lib/perl &&cluster.compiler.gcc.version -help="no" -log="5" -verbose="1" -version="no";';]]></context>
      <nice>false</nice>
    </series>
    <nickname>compiler-gnu-version-as-4.0.1</nickname>
    <resourceHostname>psc-bigben</resourceHostname>
    <schedule>
      <cron>
        <min>2</min>
        <hour>17</hour>
        <mday>*</mday>
        <wday>*</wday>
        <month>*</month>
      </cron>
      <numOccurs>-1</numOccurs>
      <suspended>false</suspended>
    </schedule>
    <acceptedOutput>
      <comparitor>ExprComparitor</comparitor>
      <comparison>gcc=~".*"</comparison>
      <notifications>
        <notification>
          <notifier>EmailNotifier</notifier>
          <target>FailTo:inca@sdsc.edu</target>
        </notification>
      </notifications>
    </acceptedOutput>
    <action>add</action>
  </seriesConfig>
  <report xmlns="">...</report>
  <comparisonResult xmlns="">Success</comparisonResult>
  <sysusage xmlns="">
    <wallClockTime>0.929562</wallClockTime>
    <memory>0.0</memory>
    <cpuTime>0.556034</cpuTime>
  </sysusage>
  <stderr xmlns=""/>
</reportDetails> |
Report detail output is surrounded by <reportDetails> tags. A prefix with a tag name that references http://inca.sdsc.edu/dataModel/reportDetails_2.1, which is the namespace that defines the report schema, can also be used.
The following tags are defined within a <reportDetails>:
- suiteId
(internal) the database identifier for the suite id number this report series belongs to (used in further queries)
- seriesConfigId
(internal) the database identifier for the series configuration information for this report series (used in further queries)
- seriesId
(internal) the database identifier for the series information for this report series (used in further queries)
- reportId
(internal) the database identifier for the report information for the particular result from this report series (used in further queries)
- instanceId
(internal) the database identifier for the instance information for the particular time this report series executed (used in further queries)
- seriesConfig
all of the configuration options for this report series: name (of reporter), version (of reporter), uri (for reporter), args, limits (for consumption of wall clock time, memory, and cpu time), context (command to execute series), nickname (of series), resourceHostname (where series will execute), schedule (cron for executing series), acceptedOutput (can include "comparison" string to match in the report and "notification" actions to take if the comparison fails)
- report
report XML like that described in Section 8.2.2
- comparisonResult
if series was configured with a comparison, the result of the comparison for this particular report series execution
- sysusage
amount of wall clock time, memory and cpu time this particular report series execution consumed
- stderr
standard error, if any, for this particular report series execution
7.2. Retrieving Data
7.2.1. REST APIs
The simplest way to retrieve Inca data is through its REST APIs. By default, the consumer recognizes a REST URL using the following format:
http://localhost:8080/inca/XML|HTML/rest/<suiteName>|<queryName>[/<resourceId>[/<seriesNickname>[/<timestamp>|week|month|quarter|year]]]
Note the rest keyword may be vary by Inca deployment. Please check with your Inca administrator for a non-default keyword.
Table 5. Examples of Inca REST URLs
REST URL | Returns |
|---|---|
Returns the latest results for the specified suite (or query) as an array of report summaries. | |
Returns the latest results for the specified suite (or query) and resource or resource group as an array of report summaries. | |
http://localhost:8080/inca/XML/rest/sampleSuite/localResource/ant_version | Returns the latest details for a specific series within the specified suite and resource according to the report details schema |
Returns the details of the instance executed at the given timestamp for a specific series within the specified suite and resource according to the report details schema | |
http://localhost:8080/inca/XML/rest/sampleSuite/localResource/ant_version/week | Returns the last week of historical results for the specified series as an array of graph instances. |
http://localhost:8080/inca/XML/rest/sampleSuite/localResource/ant_version/month | Returns the last month of historical results for the specified series as an array of graph instances. |
http://localhost:8080/inca/XML/rest/sampleSuite/localResource/ant_version/quarter | Returns the last quarter (3 months) of historical results for the specified series as an array of graph instances. |
http://localhost:8080/inca/XML/rest/sampleSuite/localResource/ant_version/year | Returns the last year of historical results for the specified series as an array of graph instances. |
For example, if you fetch the first REST URL specified above using the wget command, it would look like the following:
wget -O - http://rocks-101.sdsc.edu:8080/inca/XML/rest/sampleSuite
--09:24:30--  http://rocks-101.sdsc.edu:8080/inca/XML/rest/sampleSuite
           => `-'
Resolving rocks-101.sdsc.edu... done.
Connecting to rocks-101.sdsc.edu[198.202.88.101]:8080... connected.
HTTP request sent, awaiting response... 200 OK
Length: 6,990 [text/xml]

 0% [                                   ] 0             --.--K/s    ETA --:--

...

<quer:object
xmlns:quer="http://inca.sdsc.edu/dataModel/queryResults_2.0"><row><reportSummary
xmlns="http://inca.sdsc.edu/queryResult/reportSummary_2.0">
  <hostname xmlns="">localResource</hostname>
  <targetHostname xmlns=""/>
  <uri
xmlns="">file:///home/inca/2.6/./bin/../Inca-Reporter-5.13359/bin/grid.wget.unit</uri>
  <nickname xmlns="">wget_page_test</nickname>
  <seriesConfigId xmlns="">1</seriesConfigId>
  <instanceId xmlns="">1053</instanceId>
  <gmt xmlns="">2010-08-24T09:20:02.000-07:00</gmt>
  <gmtExpires xmlns="">2010-08-24T09:40:02.963-07:00</gmtExpires>
  <body xmlns="">
    <unitTest xmlns:rep="http://inca.sdsc.edu/dataModel/report_2.1">
      <ID>wget</ID>
    </unitTest>
  </body>
  <errorMessage xmlns=""/>
</reportSummary></row>...<row><reportSummary
xmlns="http://inca.sdsc.edu/queryResult/reportSummary_2.0">
  <hostname xmlns="">localResource</hostname>
  <targetHostname xmlns=""/>
  <uri
xmlns="">file:///home/inca/2.6/./bin/../Inca-Reporter-5.13359/bin/cluster.admin.ant.version</uri>
  <nickname xmlns="">ant_version</nickname>
  <seriesConfigId xmlns="">10</seriesConfigId>
  <instanceId xmlns="">1055</instanceId>
  <gmt xmlns="">2010-08-24T09:22:03.000-07:00</gmt>
  <gmtExpires xmlns="">2010-08-24T09:42:03.987-07:00</gmtExpires>
  <body xmlns="">
    <package xmlns:rep="http://inca.sdsc.edu/dataModel/report_2.1">
      <ID>ant</ID>
      <version>1.6.5</version>
    </package>
  </body>
  <errorMessage xmlns=""/>
</reportSummary></row></quer:object>


100%[==================================>] 6,990        273.05K/s    ETA 00:00

09:24:30 (273.05 KB/s) - `-' saved [6990/6990]
|
7.2.2. Web Services API
To query the Inca data via an API interface, you can utilize the Inca Web Services API. Please check with your Inca administrator first to check that the Web Services component is installed as described in Section 9. Next either ask your Inca administrator for the WSDL file for their deployment or download it directly from the Inca releases directory here. Then find the Inca Web Services hostname and port from your Inca administrator and edit the following portion of the file.
      ...
      <port binding="tns:IncaWS_Binding" name="IncaWS_Port">
        <soap:address location="http://localhost:8001"/>
      </port>
... |
The Web Services API encompasses a subset of the client APIs described in Section 7.2.3. Documentation for the API can be found in the below link:
http://inca.sdsc.edu/releases/2.6/wsdocs/IncaWS_wsdl.html
The following shows an example of how to access the Inca web services from Perl using the Perl module SOAP::Lite.
use SOAP::Lite;
use Cwd;

my $cwd = getcwd();
my $ws = SOAP::Lite->service("file:$cwd/etc/IncaWS.wsdl");

# check agent and depot are available
print $ws->pingAgent('hello agent'), "\n";
print $ws->pingDepot('hello depot'), "\n";

# get the Inca configuration
print $ws->getConfig(), "\n";
my $guid = $ws->queryGuids();

# get the latest instances of a suite
my $results = $ws->querySuite( $guid );
for my $result ( @{$results} ) {
  print $result;
} |
Place the above code in a file called $INCA_DIST/sampleWS.pl and edit the highlighted portion to reflect the location of the IncaWS.wsdl file. Set the environment variable PERL5LIB reflect the location of the SOAP::Lite library if it is not installed in the default path. Or if you are on the same machine as the Inca server, set it to $INCA_DIST/lib/perl. Then type,
% perl sampleWS.pl |
When run against the default installation, the results should look similar to below.
hello agent
hello depot
<inca:inca xmlns:inca="http://inca.sdsc.edu/dataModel/inca_2.0">
<repositories>
  <repository>http://inca.sdsc.edu/repository/latest</repository>
</repositories>
<resourceConfig>
  <resources>
    <resource>
        <name>defaultGrid</name>
        <xpath>//resource[matches(name, "localSite")]</xpath>
      <macros>
 ...
  </resources>
</resourceConfig>
<suites>
  <suite>
    <seriesConfigs>
      <seriesConfig>
        <series>
          <name>cluster.math.atlas.version</name>
          <uri>http:// ... cluster.math.atlas.version</uri>
          <args>
            <arg>
              <name>cc</name>
              <value>cc</value>
            </arg>
            <arg>
              <name>dir</name>
              <value/></arg>
            <arg>
              <name>help</name>
              <value>no</value>
            </arg>
            <arg>
              <name>log</name>
              <value>3</value>
            </arg>
            <arg>
              <name>verbose</name>
              <value>1</value>
            </arg>
 ...
        <action>add</action>
      </seriesConfig>
    </seriesConfigs>
    <name>sampleSuite</name>
    <guid>incas://rocks-101.sdsc.edu:6323/sampleSuite</guid>
    <description/>
    <version>1</version>
  </suite>
</suites>
</inca:inca>

<reportSummary xmlns="http://inca.sdsc.edu/queryResult/reportSummary_2.0">
  <hostname xmlns="">localResource</hostname>
  <targetHostname xmlns=""/>
  <uri xmlns="">http:// ... cluster.math.atlas.version</uri>
  <nickname xmlns="">atlas_version</nickname>
  <seriesConfigId xmlns="">1</seriesConfigId>
  <instanceId xmlns="">24</instanceId>
  <gmt xmlns="">2007-02-01T13:21:01.000-08:00</gmt>
  <body xmlns:rep="http://inca.sdsc.edu/dataModel/report_2.1" xmlns=""/>
  <errorMessage xmlns="">Cannot locate ATLAS installation; use
-dir</errorMessage>
</reportSummary>
... |
7.2.3. Inca Client APIs
An alternate method of accessing Inca data is through the the Inca Agent and Depot Client APIs. You can use this method if the Inca deployment is setup without authentication or by acquiring a set of credentials from your Inca administrator.
Currently, we provide Perl and Java client APIs to the Inca agent and depot. A number of the API functions return XML that can be used in custom Inca data consumers. For example, the DepotClient's queryInstance, queryLatest, and queryPeriod functions respectively return the report details, report summary, and graph instance XML document types described in Section 7.1. A summary of the available APIs and links to further documentation is shown in the below table.
7.2.3.1. Inca Perl Client APIs
The Perl Client API can be accessed on the Inca server at $INCA_DIST/lib/perl or by downloading the incaws tar ball, Inca-WS.tar.gz. To install Inca-WS.tar.gz, perform the following steps.
Untar the Inca-WS.tar.gz file
% tar zxvf Inca-WS.tar.gz
Install the module using the following command where $PREFIX indicates the desired destination directory.
% cd Inca-WS-*
% perl Makefile.PL PREFIX=$PREFIX LIB=$PREFIX/lib/perl
% make
% make install
Copy the credentials from your Inca administrator over to the new installation. The file trusted.0 will actually be the hash of the CA certificate and will look something like 51b63f6c.0.
% mkdir $PREFIX/etc; mkdir $PREFIX/etc/trusted
% cp clientcert.pem $PREFIX/etc
% cp clientkey.pem $PREFIX/etc
% cp trusted.0 $PREFIX/etc/trusted
Below is a sample of code using the Perl APIs that pings the Agent and queries for its configuration.
#!/usr/bin/perl

use strict;
use warnings;
use Inca::AgentClient;

print "Please enter a password:  ";
chomp( my $pass = <STDIN> );
my $agentclient = new Inca::AgentClient(
  host => 'localhost',
  port => 6323,
  auth => 1,
  cert => 'etc/clientcert.pem',
  key => 'etc/clientkey.pem',
  password => $pass,
  trusted => 'etc/trusted/51b63f6c.0'
);
if ( defined $agentclient->getError() ) {
  die "Unable to connect:" . $agentclient->getError();
}

# check agent is available
print $agentclient->ping('hello agent'), "\n";

# get the Inca configuration
print $agentclient->getConfig(), "\n"; |
Place the code in a file called inca-test-agent within the $INCA_DIST/bin directory and replace all of the highlighted areas with values appropriate to your installation. To run the program, you will need to provide the path to the Inca Perl APIs which reside in $INCA_DIST/lib/perl. One choice is to execute the following:
env PERL5LIB=$PREFIX/lib/perl perl bin/inca-test-agent |
Type in the password provided to you by your Inca administrator when prompted. You should see something like this:
hello agent
<inca:inca xmlns:inca="http://inca.sdsc.edu/dataModel/inca_2.0">
<repositories>
  <repository>http://inca.sdsc.edu/repository/latest</repository>
</repositories>
<resourceConfig>
  <resources>
    <resource>
        <name>defaultGrid</name>
        <xpath>//resource[matches(name, "localSite")]</xpath>
      <macros>
 ...
  </resources>
</resourceConfig>
<suites>
  <suite>
    <seriesConfigs>
      <seriesConfig>
        <series>
          <name>cluster.math.atlas.version</name>
          <uri>http:// ... cluster.math.atlas.version</uri>
          <args>
            <arg>
              <name>cc</name>
              <value>cc</value>
            </arg>
            <arg>
              <name>dir</name>
              <value/></arg>
            <arg>
              <name>help</name>
              <value>no</value>
            </arg>
            <arg>
              <name>log</name>
              <value>3</value>
            </arg>
            <arg>
              <name>verbose</name>
              <value>1</value>
            </arg>
 ...
        <action>add</action>
      </seriesConfig>
    </seriesConfigs>
    <name>sampleSuite</name>
    <guid>incas://rocks-101.sdsc.edu:6323/sampleSuite</guid>
    <description/>
    <version>1</version>
  </suite>
</suites>
</inca:inca> |
Alternatively, you can leverage the inca script to set the path for you. It looks for scripts that begin with inca- in the bin such as inca-some-command. Then you can invoke your script by typing ./sbin/inca someCommand which will automatically set the PERL5LIB for you. To execute the inca-test-agent script, type the following:
% cd $PREFIX; ./sbin/inca testAgent -P stdin:pass |
Type in the password provided to you by your Inca administrator when prompted. You should see the output as above.
7.2.3.2. Inca Java Client APIs
The Java Client API can be accessed on the Inca server at $INCA_DIST/lib/inca-common.jar or by downloading the inca-common tar ball, inca-common-java-bin.tar.gz. To install inca-common-java-bin.tar.gz in a directory called $PREFIX, perform the following steps.
Untar the inca-common-java-bin.tar.gz file
% mkdir $PREFIX; tar -C $PREFIX -zxvf inca-common-java-bin.tar.gz
Copy the credentials from your Inca administrator over to the new installation. The file trusted.0 will actually be the hash of the CA certificate and will look something like 51b63f6c.0.
% mkdir $PREFIX/etc; mkdir $PREFIX/etc/trusted
% cp clientcert.pem $PREFIX/etc
% cp clientkey.pem $PREFIX/etc
% cp trusted.0 $PREFIX/etc/trusted
Below is a sample of code using the Java APIs that pings the Agent and queries for its configuration.
import edu.sdsc.inca.AgentClient;

public class AgentClientTest {
  public static void main(String args[]) {
    AgentClient agentClient = new AgentClient();
    agentClient.setServer("rocks-101.sdsc.edu", 6323);
    agentClient.setCertificatePath("clientcert.pem");
    agentClient.setKeyPath("clientkey.pem");
    agentClient.setTrustedPath("trusted");
    System.out.print( "Please enter a password: " );
    try {
      BufferedReader br = new BufferedReader(new InputStreamReader(System.in));
      String password = br.readLine();
      agentClient.setPassword(password);
    } catch ( IOException e  ) {
      System.err.println( "Problems reading password" );
      e.printStackTrace();
    }
    try {
      agentClient.connect();
      System.out.println( agentClient.commandPing("hello agent") );
      System.out.println( agentClient.getConfig() );
    } catch ( Exception e ) {
      System.err.println( "Connection error to agent" );
      e.printStackTrace();
    }
  }
} |
Place the code in a file called AgentClientTest.java within the $INCA_DIST directory and replace all of the highlighted areas with values appropriate to your installation. Note that the API looks for certificate files in the classpath so just the name of the file needs to be specified rather than a complete path. First set your classpath to include the jars in $INCA_DIST/lib as below:
% setenv CLASSPATH `perl -e "print join(':',glob('lib/*'))"`

or

% export CLASSPATH=`perl -e "print join(':',glob('lib/*'))"` |
Then compile the program as below:
% javac AgentClientTest.java |
This will create the file AgentClientTest.class. To run the program, you will also need to specify the directory where your credentials reside (specified below as etc), the etc/common directory, and . where the AgentClientTest.class resides. Execute as follows:
% java -cp .:etc:etc/common:$CLASSPATH AgentClientTest |
Type in the password provided to you by your Inca administrator when prompted. You should see something like this:
hello agent
<inca:inca xmlns:inca="http://inca.sdsc.edu/dataModel/inca_2.0">
<repositories>
  <repository>http://inca.sdsc.edu/repository/latest</repository>
</repositories>
<resourceConfig>
  <resources>
    <resource>
        <name>defaultGrid</name>
        <xpath>//resource[matches(name, "localSite")]</xpath>
      <macros>
 ...
  </resources>
</resourceConfig>
<suites>
  <suite>
    <seriesConfigs>
      <seriesConfig>
        <series>
          <name>cluster.math.atlas.version</name>
          <uri>http:// ... cluster.math.atlas.version</uri>
          <args>
            <arg>
              <name>cc</name>
              <value>cc</value>
            </arg>
            <arg>
              <name>dir</name>
              <value/></arg>
            <arg>
              <name>help</name>
              <value>no</value>
            </arg>
            <arg>
              <name>log</name>
              <value>3</value>
            </arg>
            <arg>
              <name>verbose</name>
              <value>1</value>
            </arg>
 ...
        <action>add</action>
      </seriesConfig>
    </seriesConfigs>
    <name>sampleSuite</name>
    <guid>incas://rocks-101.sdsc.edu:6323/sampleSuite</guid>
    <description/>
    <version>1</version>
  </suite>
</suites>
</inca:inca> |
8. Reporters and Repositories
Inca reporters are executable programs and scripts, generally small, that test and report the health and characteristics of a system. The figure below illustrates a typical Inca installation where reporters are retrieved from a repository and sent to Reporter Managers on Grid resources by the Agent. The Reporter Managers then execute the reporters based on series configuration from the Agent and send the XML reports to the Depot for storage.
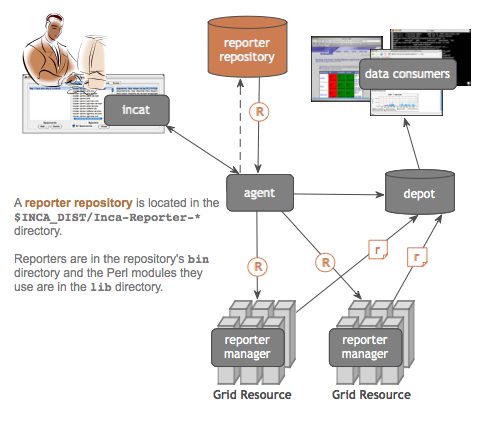
8.1. Executing Reporters
Because they are executables, Inca reporters are independent of the rest of the Inca system. Reporters can be executed manually from a command line or automatically as part of an Inca installation. Incorporating your own reporters into a running Inca installation requires only writing the reporters (Section 8.2), including them in a repository (Section 8.3), and configuring the repository's series using incat (Section 5). Most developers will execute reporters from the command line before adding them to their Inca installation. After installing Inca, you can try executing some of the reporters that come with the distribution from the command line:
% cd $INCA_DIST/Inca-Reporter-*/bin % setenv PERL5LIB ../lib/perl % setenv PYTHONPATH ../lib/python % ./cluster.compiler.gcc.version |
All Inca reporters must support the command line arguments listed in the table below. In addition, a reporter may support additional command line arguments specific to that reporter's task.
Table 7. Reporter Command Line Arguments
Argument | Valid Values | Default Value | Description |
|---|---|---|---|
-help | yes|no | no | Do not run the reporter; instead, print information on running it. If the value of the verbose argument is 0, this information will be readable text; otherwise, it will be reporter XML. |
-log | 0-5|debug|error|info|system|warn | 0 | Include reporter log messages in the reporter output. The named argument values indicate specific types of log messages that should be included. 0 indicates no log messages should be included; the other numeric values indicate error, warn, system, info, and debug messages, cumulatively. For example, --log=2 indicates both error and warn messages should be included, while --log=4 includes error, warn, system, and info messages. |
-verbose | 0-2 | 1 | Determine what the reporter prints. A verbose level of 0 indicates that the reporter prints only 'completed' or 'failed', depending on the outcome of its testing. Verbose level 1 produces XML that reports the testing result, and verbose level 2 adds additional tags to this XML to give instructions on running the reporter. |
-version | yes|no | no | Do not run the reporter; instead, print its version number. |
Executing a reporter using different arguments:
% ./cluster.compiler.gcc.version -log=3 % ./cluster.compiler.gcc.version -help=yes -verbose=0 % ./cluster.compiler.gcc.version -version=yes |
8.2. Writing Reporters
Reporters can be written in any language as long as they output XML according to the schema described in Section 8.2.1. New reporter developers may choose to write reporters in Perl or Python since the Inca distribution includes sample reporters and API modules in those languages (Section 8.2.3) for printing XML according to our schema.
NOTE: Because databases impose a 4000 character limit on text fields, the XML portion of the report for logging/debugging and the error message must each be smaller than 4000 characters. The body XML can be 12000 characters because it is stored in three parts. If the report XML is greater than its limit, the depot truncates the oversized section from the beginning until it is the right size.
Table 8. Report Character Limits
Report XML Section | Character limit |
|---|---|
log | 4000 |
error (exit) message | 4000 |
body | 12000 |
8.2.1. Reporter XML Schema
In order to promote interoperability between reporters, we define a specification for how reporter output should be formatted. Given the wide acceptance and availability of tools for XML, the specification requires that reporter output should be formatted using XML. Furthermore, we specify a basic schema that the XML should follow so that we can handle the output in a general manner. The goal of this schema is to be flexible enough to express a wide variety of data.
Our approach is to require a number of XML fields which provide metadata about the output and define one of the fields, body, to be abstract. The body field is a placeholder for the formatted output and can be replaced by any XML substitution group thereby allowing this schema to accommodate a large variety of output. In other words, the basic schema is like an abstract class and the substitution groups provide for subclassing.
The reporter schema is visualized in Figure 23.
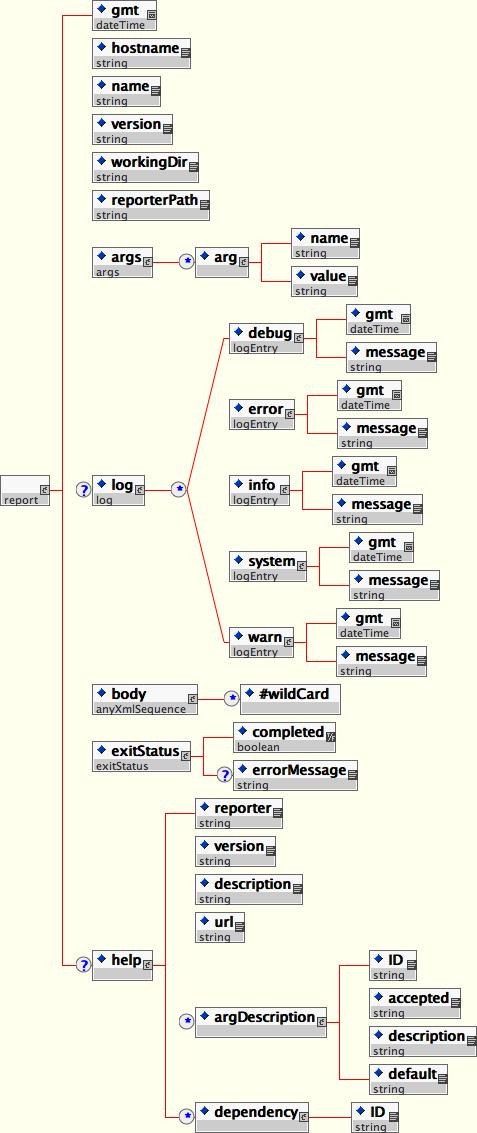
8.2.2. Reporter XML Output
Here is the output from the successful run of a typical Inca reporter. The content and meaning of the XML tags is described below.
Figure 24. Example of Reporter Output
<?xml version='1.0'?>
<inca:report xmlns:inca='http://inca.sdsc.edu/dataModel/report_2.1'>
  <gmt>2006-11-17T17:35:40Z</gmt>
  <hostname>jhayes-Computer.local</hostname>
  <name>cluster.compiler.gcc.version</name>
  <version>2</version>
  <workingDir>/Users/jhayes/Inca/subversion/inca/trunk/devel/reporters/bin</workingDir>
  <reporterPath>cluster.compiler.gcc.version</reporterPath>
  <args>
    <arg>
      <name>help</name>
      <value>no</value>
    </arg>
    <arg>
      <name>log</name>
      <value>0</value>
    </arg>
    <arg>
      <name>verbose</name>
      <value>1</value>
    </arg>
    <arg>
      <name>version</name>
      <value>no</value>
    </arg>
  </args>
  <body>
    <package>
      <ID>gcc</ID>
      <version>3.3</version>
    </package>
  </body>
  <exitStatus>
    <completed>true</completed>
  </exitStatus>
</inca:report> |
As shown in Figure 24, reporter output begins with an XML preamble and is surrounded by <report> tags. A prefix with a tag name that references http://inca.sdsc.edu/dataModel/report_2.1, which is the namespace that defines the report schema, can also be used.
The following tags are defined within a <report>:
- gmt
the time the reporter ran (ISO 8601 format)
- hostname
host where reporter ran
- name
reporter name
- version
reporter version number
- workingDir
directory where reporter execution begins
- reporterPath
local path to reporter file
- args
args must contain an arg name/value entry for every argument the reporter supports, including those for which the reporter supplies a default value (help, log, verbose, version)
- log
OPTIONAL TAG (not shown in Figure 24 report). Log entries produced by the reporter. This tag contains one or more <debug>, <error>, <info>, <system>, and/or <warn> tags, each of which gives the text of the message and the time it was produced. Here is a typical example of a log section:
<log> <system> <gmt>2006-11-17T18:28:10Z</gmt> <message>grid-proxy-info 2>&1</message> </system> <debug> <gmt>2006-11-17T18:28:10Z</gmt> <message>Checking for grid proxy: Result of command "grid-proxy-info": sh: line 1: grid-proxy-info: command not found </message> </debug> <error> <gmt>2006-11-17T18:28:10Z</gmt> <message>ERROR: Valid proxy needed for file transfer.</message> </error> </log>- body
The body tag contains the results of the reporter testing. The only requirement for the contents of this tag is that they must be well-formed XML--tags balanced and no extraneous <, >, and & characters. Figure 24 shows the conventional body for version reporters.
- exitStatus
Includes the boolean <completed> tag, indicating whether or not the reporter successfully completed its testing, and the optional <errorMessage> tag, which contains a string indicating why the reporter failed to complete.
- help
OPTIONAL TAG (not shown in Figure 24 report). The help tag describes the reporter and how to run it. Contents include the reporter name, version, description, and url, detailed descriptions of each argument, and an optional list of dependencies that the reporter has on other packages. For example, here is the <help> section for the gcc version reporter.
  <help>
    <ID>help</ID>
    <name>cluster.compiler.gcc.version</name>
    <version>2</version>
    <description>Reports the version of gcc</description>
    <url>http://gcc.gnu.org</url>
    <argDescription>
      <ID>help</ID>
      <accepted>no|yes</accepted>
      <description>display usage information (no|yes)</description>
      <default>no</default>
    </argDescription>
    <argDescription>
      <ID>log</ID>
      <accepted>[012345]|debug|error|info|system|warn</accepted>
      <description>log message types included in report</description>
      <default>0</default>
    </argDescription>
    <argDescription>
      <ID>verbose</ID>
      <accepted>[012]</accepted>
      <description>verbosity level (0|1|2)</description>
      <default>1</default>
    </argDescription>
    <argDescription>
      <ID>version</ID>
      <accepted>no|yes</accepted>
      <description>show reporter version (no|yes)</description>
      <default>no</default>
    </argDescription>
    <dependency>
      <ID>Inca::Reporter</ID>
    </dependency>
    <dependency>
      <ID>Inca::Reporter::Version</ID>
    </dependency>
  </help>
8.2.3. Reporter APIs
The Inca release includes a set of Perl modules and a Python package that make it easier to develop reporters that produce output as shown in Section 8.2.2 and conform to the schema described in Section 8.2.1. The following are a list of modules and their purpose (click on module names for manpages):
This module is the general reporter API and is the base class for all types of reporters. It automates determination of hostname, gmt, reporter name, etc., handles command-line parsing, provides an interface for log messages, and handles XML generation.
This module is used for Globus unit tests. it provides methods for running Globus jobs.
The Inca::Reporter::GridProxy package is a pseudo-module indicating that a reporter requires a proxy credential in order to execute. The following is an example of a perl reporter that requires a proxy. Python reporters should use the equivalent, reporter.addDependency('inca.GridProxyReporter').
#!/usr/bin/env perl use strict; use warnings; use Inca::Reporter::SimpleUnit; my $reporter = new Inca::Reporter::SimpleUnit( name => 'grid.middleware.globus.unit.proxy', version => 2, description => 'Verifies that user has valid proxy', url => 'http://www.globus.org/security/proxy.html', unit_name => 'validproxy' ); $reporter->addDependency( "Inca::Reporter::GridProxy" ); $reporter->processArgv(@ARGV); # check to see if proxy has enough time left $reporter->log( 'info', "X509_USER_PROXY=$ENV{X509_USER_PROXY}" ); my $output = $reporter->loggedCommand('grid-proxy-info -exists -hours 4 2>&1'); if( $? != 0 ) { $reporter->unitFailure("grid-proxy-info failed: $! $output"); } else { $reporter->unitSuccess(); } $reporter->print();This module is used to gather system performance metrics. It defines a common <body> schema for system/software performance metric reporters and produces a collection of benchmarks, each a set of parameters (name/value) and statistics (name/value/units). A dependent Benchmark class is used to define individual benchmarks.
This module is used for software unit tests. It defines a common <body> schema for unit test reporters and provides methods for recording results of unit tests.
This module is used for creating simple usage reports.
This module is used for reporting software versions. It defines a common <body> schema for version reporters, offers support for subpackage versions, and provides convenience methods for common ways of determining version.
The following is the Perl code for a reporter that produces output like Figure 24. This reporter uses the Inca::Reporter::Version module to determine the version of gcc. Examples of reporters that use the other modules are located in $INCA_DIST/Inca-Reporter-*/bin.
#!/usr/bin/env perl

use strict;
use warnings;
use Inca::Reporter::Version;

my $reporter = new Inca::Reporter::Version(
  name => 'cluster.compiler.gcc.version',
  version => 2,
  description => 'Reports the version of gcc',
  url => 'http://gcc.gnu.org',
  package_name => 'gcc'
);
$reporter->processArgv(@ARGV);

$reporter->setVersionByExecutable('gcc -dumpversion');
$reporter->print(); |
8.2.4. Reporter Writing Tips
In general using the reporter APIs described in Section 8.2.3 will help to produce the most efficient reporter code. There are additional considerations when writing reporters that:
create temporary files and directories
cd to directories with variable names
include variable information like timestamps or PIDs in the exit error message
For reporters that create temporary files or directories, the APIs offer a function called "tempFile" to remove them. If the tempFile function is used then additional code to remove temporary files or directories (e.g. unlink or rm) is not required. The reporter below uses the tempFile function to remove the temp $scratchDir it creates.
It's best practice never to use a PID or variable information as a reporter argument value or to include PIDs or timestamps in error messages. Reporters that incorporate this sort of information will create a new report in the Inca database each time the reporter runs, which may slow query response. If a reporter error message may contain variable information, a function to replace the variable can be written to normalize the error (like the "failClean" function in the reporter below).
#!/usr/bin/env perl

use strict;
use warnings;
use Inca::Reporter::SimpleUnit;
use Date::Parse;
use Cwd;

my $reporter = new Inca::Reporter::SimpleUnit(
  name => 'security.ca.unit',
  version => 9,
  description => 'Checks whether the CA certificates or CRLs have expired',
  unit_name => 'caCertNCrlExpire'
);

 ...

my $scratchDir = "/tmp/security.ca.unit.$$";
if ( ! mkdir($scratchDir) ) {
  failClean("Cannot mkdir scratch dir $scratchDir");
}
$reporter->tempFile( $scratchDir );
if ( ! chdir($scratchDir) ) {
  failClean("Cannot change to scratch dir $scratchDir");
}

 ...

if ($err ne ""){
  failClean($err);
} else {
  $reporter->unitSuccess();
  $reporter->print();
}

sub failClean {
  my $err = shift;
  $err =~ s/--\d{2}:\d{2}:\d{2}--/--xx:xx:xx--/g;
  $err =~ s/$$/PID/g;
  $reporter->failPrintAndExit($err);
} |
8.3. Reporter Repositories
The Inca system retrieves reporters from external collections called repositories. A reporter repository is simply a file directory, accessed via a file: or http: URL, that contains a catalog file named Packages.gz. This gzipped file includes a sequence of name:value attribute pairs for every reporter and support package in the repository; blank lines separate the attributes for different reporters. For example, here is a portion of the Packages.gz file for the Inca standard reporter repository.
arguments: help no|yes no;log [012345]|debug|error|info|system|warn 0;verbose [0 12] 1;version no|yes no dependencies: Inca::Reporter;Inca::Reporter::Version description: Reports the version of tgusage file: cluster.accounting.tgusage.version name: cluster.accounting.tgusage.version url: http://www.teragrid.org version: 2 arguments: help no|yes no;log [012345]|debug|error|info|system|warn 0;verbose [0 12] 1;version no|yes no dependencies: Inca::Reporter;Inca::Reporter::SimpleUnit description: ant hello world test file: cluster.admin.ant.unit name: cluster.admin.ant.unit version: 3 arguments: help no|yes no;log [012345]|debug|error|info|system|warn 0;verbose [0 12] 1;version no|yes no dependencies: Inca::Reporter;Inca::Reporter::Version description: Reports the version of Apache Ant file: cluster.admin.ant.version name: cluster.admin.ant.version version: 2 |
Of the attributes shown, only file and name are required. The file attribute gives the relative path to the reporter file, and the name attribute specifies the unique package name of the reporter. If the reporter requires support packages to execute, it should include a dependencies attribute with a semicolon-separated list of package names. For more information about reporter package dependencies see Section 8.3.1. The incat administration tool uses the Packages.gz file's arguments and description attributes as part of its series edit dialog. The value of the arguments attribute is a semicolon-separated list giving the name, value pattern, and default value, if any, for each supported command-line argument.
To create a local repository for your own reporters, you only need to collect them into a directory and create a Packages.gz in that directory. The default Inca installation has a Packages.gz file in $INCA_DIST/Inca-Reporter-* that can be added in incat. Inca also supplies a web accessible repository that can be added in incat as "http://inca.sdsc.edu/repository/latest/".
The Inca distribution includes a perl script, incpack, that can create Packages.gz for you. Simply run incpack with a list of reporters that you want to include in Packages.gz, e.g.,
% perl incpack jade.version f77.unit vim.version |
incpack runs each of the listed reporters with --help=yes --verbose=1 to extract a standard set of attributes. If your reporters use the Inca reporter APIs, you might need to run incpack with -I switches to specify the location of the Inca libraries, like this.
% perl incpack -I ${INCA_DIST}/lib/perl -I ${INCA_DIST}/lib/python jade.version f77.unit vim.version |
For more information about incpack usage, click here.
8.3.1. Reporter Package Dependencies
Some reporters may require a CPAN Perl module, C library, compiled executable, or some other tar.gz packaged dependency. Reporters can use packaged dependencies if the dependencies are 1) bundled into a tar.gz file, 2) added using incpack to the reporter repository, and 3) noted as a dependency in the reporters.
For example, the cluster.math.blas.unit.level1 reporter wraps the Level 1 BLAS Test Suite available from the Basic Linear Algebra Subprograms (BLAS) website. To add the BLAS Test Suite as a dependency to the cluster.math.blas.unit.level1 reporter, use the following steps:
Package the Level1 BLAS Test Suite files (fortran code) into a tar.gz called blasTestSuite.tar.gz along with a Makefile and configure script. The blasTestSuite.tar.gz file contains:
Makefile.in     cblat2d         configure       dblat2.f        dblat3d         sblat2d         zblat1.f        zblat3.f
cblat1.f        cblat3.f        configure.in    dblat2d         sblat1.f        sblat3.f        zblat2.f        zblat3d
cblat2.f        cblat3d         dblat1.f        dblat3.f        sblat2.f        sblat3d         zblat2d
Update the reporter repository with the package dependency using an .attrib file. An .attrib file contains information about the dependency such as its name, version number, description, a descriptive url and dependencies. The .attrib file needs to be prefixed with the tar.gz name. For example, the BLAS Test Suite's .attrib would be named blasTestSuite.tar.gz.attrib and contain:
name: blasTestSuite
version: 1.0
description: Test programs for the BLAS library
url: http://inca.sdsc.edu
dependencies:
Both the blasTestSuite.tar.gz and blasTestSuite.tar.gz.attrib files are then placed in the share directory or can be placed anywhere inside the repository directory. Then the dependency is added to the repository using incpack (see Section 8.3.2 for more about repository updates):
% sbin/incpack share/blasTestSuite.tar.gz
Note: Appending to existing Packages.gz file
share/blasTestSuite.tar.gz
Include the following line in reporters that use the blasTestSuite dependency before $reporter->processArgv is called. Use the name specified in the .attrib file:
$reporter->addDependency('blasTestSuite');Then add the reporter to the repository using incpack:
% sbin/incpack -I lib/perl -I lib/python bin/cluster.math.blas.unit.level1
Note: Appending to existing Packages.gz file
bin/cluster.math.blas.unit.level1
After unzipping and untarring the package file, the reporter manager builds the package in one of several ways, depending on the contents of the package directory. If a configure is present, the reporter manager executes these commands to build the package:
% ./configure --prefix=$RM_INSTALL_DIR/var/reporter-packages % [g]make % [g]make install |
Otherwise, if a [Mm]akefile is present, then the reporter manager executes these commands:
% [g]make INSTALL_DIR=$RM_INSTALL_DIR/var/reporter-packages % [g]make INSTALL_DIR=$RM_INSTALL_DIR=/var/reporter-packages |
Otherwise, if a Makefile.PL file (i.e., Perl package) is found, then the following is executed:
% perl -I$RM_INSTALL_DIR/var/reporter-packages/lib/perl Makefile.PL \ PREFIX=$RM_INSTALL_DIR/var/reporter-packages/lib/perl \ LIB=$RM_INSTALL_DIR/var/reporter-packages/lib/perl \ INSTALLDIRS=perl \ INSTALLSCRIPT=$RM_INSTALL_DIR/var/reporter-packages/bin \ INSTALLMAN1DIR=$RM_INSTALL_DIR/var/reporter-packages/man/man1 \ INSTALLMAN3DIR=$RM_INSTALL_DIR/var/reporter-packages/man/man3 % [g]make % [g]make install |
Otherwise, if a Build.PL file is found, then the following commands are executed:
% perl -I$RM_INSTALL_DIR/var/reporter-packages/lib/perl Build.PL \ --install_path lib=$RM_INSTALL_DIR/var/reporter-packages/lib/perl \ --install_path libdoc=$RM_INSTALL_DIR/var/reporter-packages/man/man3 \ --install_path bindoc=$RM_INSTALL_DIR/var/reporter-packages/man/man1 \ --install_path bin=$RM_INSTALL_DIR/var/reporter-packages/bin \ --install_path script=$RM_INSTALL_DIR/var/reporter-packages/bin \ --install_path arch=$RM_INSTALL_DIR/var/reporter-packages/lib/perl % perl -I$RM_INSTALL_DIR/var/reporter-packages/lib/perl Build % perl -I$RM_INSTALL_DIR/var/reporter-packages/lib/perl Build install |
If none of the files listed above are present, the reporter manager assumes that no build step is needed for the package.
The reporter manager sets the INSTALL_DIR environment variable before running a reporter. Reporters that depend on other packages can use this variable to locate the package files--libraries in $INSTALL_DIR/lib, binaries in $INSTALL_DIR/bin, etc.
8.3.2. Updating Reporter Repositories
The Inca agent will detect changes to your reporter repository and automatically send changes to the appropriate reporter managers if you:
update the reporter version number (ie. change a line like "version => 1" to "version => 2" in the body of the reporter)
make sure the reporter permissions are set so the agent can fetch the reporter (755 is the standard reporter permission)
update your Packages.gz file using incpack. The command will be something like:
% cd $INCA_DIST/Inca-Reporter-*; ./sbin/incpack -I lib bin/<reportername>
wait for the agent to deploy the new reporter automatically (it looks for new reporters every four hours by default),
*OR*
restart the agent,
*OR*
Connect to the agent in incat, select the Repositories tab, then press the Refresh button under the repository panel.
If the revised reporter still isn't deployed, look for any errors in the $INCA_DIST/var/agent.log that indicate the agent was unable to fetch the reporter or skipped over updating it. Make sure there is an active series that uses the reporter with "use latest version" checked on the resource your intend it to run on incat. Look for $INCA_DIST/var/repository/repository.xml entries for the reporter with "<latestVersion>false</latestVersion>" (should be "<latestVersion>true</latestVersion>" to get the updated reporters).
9. Web Services
In oder to enable customized data consumers as described in Section 7 that utilize the Web Services API, you will need to install the Inca web services component, incaws.
% wget http://inca.sdsc.edu/releases/2.6/incaInstall.sh % sh incaInstall.sh $INCA_DIST incaws |
The results should look similar to:
Retrieving http://inca.sdsc.edu/releases/latest/Inca-WS.tar.gz
--12:59:23--  http://inca.sdsc.edu/releases/latest/Inca-WS.tar.gz
           => `Inca-WS.tar.gz'
Resolving inca.sdsc.edu... 198.202.75.28
Connecting to inca.sdsc.edu|198.202.75.28|:80... connected.
HTTP request sent, awaiting response... 200 OK
Length: 1,226,347 (1.2M) [application/x-tar]

100%[====================================>] 1,226,347     --.--K/s

12:59:23 (81.68 MB/s) - `Inca-WS.tar.gz' saved [1226347/1226347]

Unpacking http://inca.sdsc.edu/releases/latest/Inca-WS.tar.gz
Inca-WS-1.6421/
Inca-WS-1.6421/lib/
...
Inca-WS-1.6421/etc/IncaWS.wsdl
Inca-WS-1.6421/version.svn
Will install Inca prerequisite Net::SSLeay
Will install Inca prerequisite IO::Socket::SSL
Will install Inca prerequisite Expat
Will install Inca prerequisite LWP::UserAgent
Will install Inca prerequisite MIME::Base64
Will install Inca prerequisite SOAP::Lite
Writing Makefile.perl.inc for Inca-WS
Inca-WS installed |
To start incaws, specify the port, credentials, and hostname/port for the Inca agent and depot as below. Replace "origHost", "agentHost" and "depotHost" with the correct names for your installation.
% cd $INCA_DIST % ./bin/inca incaws \ --auth=yes \ --cert=etc/agentcert.pem \ --key=etc/agentkey.pem \ --trusted=etc/trusted/origHostcert.pem \ --port=8001 \ --password=yes \ depotHost:6324 \ agentHost:6323 enter password (no prompt displayed) |
Check to make sure the incaws is running on port 8001 (error logs are in $INCA_DIST/var):
% netstat -an | grep 8001 tcp4 0 0 *.8001 *.* LISTEN |
Please see Section 7.2.2 for documentation and examples of how to use the Inca Web Services API.
10. Security
By default, inca components use ssl to communicate with each other. Credentials are automatically generated with the "bin/inca createauth" command described in step 4 of the quickstart guide. The createauth command creates keys and certificates for each inca component (the agent, depot, consumer and incat) and stores them in the $INCA_DIST/etc directory.
Inca can also be run without ssl communication (credentials then do not need to be created with the "createauth" command). To turn off ssl communication, edit the $INCA_DIST/etc/common/inca.properties file as follows:
replace all instances of "incas" with "inca"
change these lines to turn authentication off:
9 # To turn authentication (i.e., SSL communication) off and on
10 inca.agent.auth=false
11 #inca.agent.auth=true
...
67 # To turn authentication (i.e., SSL communication) off and on
68 inca.depot.auth=false
69 #inca.depot.auth=true
...
110 # To turn authentication (i.e., SSL communication) off and on
111 inca.consumer.auth=false
112 #inca.consumer.auth=true
11. Advanced Configuration
This section describes advanced configuration options such as installing components in non-default locations and changing other default properties.
11.1. Inca Component Options
Each inca component has a set of options that can be set in either the $INCA_DIST/etc/common/inca.properties file or from the command line. The inca.properties file has a list of name value pairs of the format "inca.component.property=value". For example, to start the agent on port 5323 instead of 6323 and enter the password on the command line rather than get it from standard in, you could:
edit $INCA_DIST/etc/common/inca.properties and replace:
"inca.agent.port=6323" with "inca.agent.port=5323"
"inca.agent.password=stdin:password>" with "inca.agent.password=pass:<password>" (where <password> is the password set with the createauth command)
execute:
% cd $INCA_DIST; ./bin/inca start agent
OR execute the following command:
% cd $INCA_DIST; ./bin/inca start agent -p 5323 -P pass:<password>
Man pages with component options are described in Section 12.
Note: To change the port of the consumer, see Section 6.12.
Note: if you have more than 5 reporter managers running, increase the number of agent and depot threads in the inca.properties file to be 10 more than the number of reporter managers. For example, if running 15 reporter managers edit the inca.properties file as follows:
31 # Maximum number of threads running on the agent 32 inca.agent.numthreads=25 ... 82 # Maximum number of threads running on the depot 83 inca.depot.numthreads=25 |
11.2. Customizing Series Notification
To customize the notification you receive whenever the result of a series comparison changes, you can either modify the default Inca notification scripts (found in the sbin/ subdirectory of your Inca Depot installation) or write your own. Set inca.incat.notifiers in your inca.property file to add a new script to the options presented in the incat series dialog. For example, to add a script named "MyNotifier" to the options, you would add the following line to inca.properties.
inca.incat.notifiers=EmailNotifier,LogNotifier,MyNotifier |
The Inca Depot sets environment variables that provide information to the notification script about the series and comparison, and the script can incorporate these variables into its notification. For example, EmailNotifier uses several of these variables in constructing the email body. These are the environment variable names that the Depot defines:
Table 9. Email Macro Names
Name | Meaning |
|---|---|
incaargs | the arguments passed to the reporter |
incabody | the report body |
incacollected | the time the reporter ran |
incacommited | the time the report was entered in the Depot |
incacomparison | the comparison specified for this series |
incacomparisonResult | the output of the comparison for this report, typically "SUCCESS" or "FAIL" followed by a list of identifiers |
incacompleted | whether or not the reporter completed execution |
incaconfigId | the Inca database id of the series configuration |
incacontext | the complete command, including arguments, used to execute the reporter |
incacpuLimit | the maximum CPU seconds allowed for this reporter to execute |
incacpuUsage | the actual CPU seconds used by this reporter execution |
incaerrorMessage | any failure message recorded by the reporter |
incahostname | the name of the host where the reporter executed |
incainstanceId | the Inca database id of this reporter execution |
incalog | log messages recorded by the reporter |
incamemoryLimit | the maximum memory MB allowed for this reporter to execute |
incamemoryUsage | the actual memory MB used by this reporter execution |
incanickname | the nickname of this series |
incareportId | the Inca database id of the report |
incareporter | the name of the reporter |
incareporterPath | the path to the reporter on the host where it executed |
incaresource | the name of the Inca resource where the reporter executed |
incaresult | "PASS" or "FAIL", depending on whether or not the reporter completed execution |
incaschedule | the cron spec for this series' schedule |
incaseriesId | the Inca database id of this series |
incastderr | any text written by the reporter to stderr |
incauri | the reporter URI |
incaversion | the reporter version |
incawallClockLimit | the maximum wall clock seconds allowed for this reporter to execute |
incawallClockUsage | the actual wall clock seconds used by this reporter execution |
incaworkingDir | the working directory for the reporter manager on the host where the reporter executed |
Values that are specified as the "Script Arguments" in incat are passed as arguments to the script.
11.3. Report Filtering
The Inca Depot allows you to filtering incoming reports before information about them is placed in the Inca database. To do so, you need to write a class that extends edu.sdsc.inca.depot.util.ReportFilter and set the property inca.depot.reportFilter to the name of the class.
An Inca report consists of five elements, all strings: the execution context (reporter name and arguments), the name of the resource where the reporter ran, the reporter stdout (i.e., report), the reporter stderr, and a report of the system resources used by the reporter execution. Of these, stderr may be null; the other four are required.
The ReportFilter class provides set and get methods for each of these five elements. If the inca.depot.reportFilter property is set, the Inca Depot creates an instance of the named class, then calls each of its set and get methods in turn to allow it to make changes to any of the elements. Changes made by the filter are incorporated into the information stored in the Depot database. If a ReportFilter get method for any of the elements other than stderr returns null, the Depot discards the report.
For example, this class directs the Depot to ignore reports that arrive from blue.ufo.edu and modifies report stderr values that contain particular messages.
public class MyReportFilter extends edu.sdsc.inca.depot.util.ReportFilter {

  public String getResource() {
    String resource = super.getResource();
    return resource.equals("blue.ufo.edu") ? null : resource;
  }

  public String getStderr() {
    String stderr = super.getStderr();
    stderr = stderr.replaceAll("Try again.*\n", "");
    return stderr;
  }

} |
To install your filter, first compile the class.
% javac -classpath lib/inca-depot.jar MyReportFilter.java |
Copy the compiled class to your $INCA_DIST/lib directory. For example,
% cp MyReportFilter.class $INCA_DIST/lib |
Then add the inca.depot.reportFilter property to your $INCA_DIST/etc/common/inca.properties file.
... inca.depot.reportFilter=MyReportFilter ... |
Finally, restart the depot.
% ./bin/inca restart depot |
11.3.1. Downtime Filter
The depot has a ready to use filter called "DowntimeFilter" that prefixes the error messages of resources marked as down with "DOWNTIME: +optionalString+:". By default the consumer will display results with a error message starting with "DOWNTIME:" neutrally - summary pages print the result as "down" instead of "error" and historical graphs show the result as "unknown". The consumer has templates in the inca-common.xsl stylesheet called "getLink" and "getDownErr" to display errors generated by the downtime filter in the report summary and details pages.
The downtime filter is included in the inca-depot.jar and looks like:
package edu.sdsc.inca.depot.util;

import org.apache.log4j.Logger;
import java.net.URL;
import java.util.Properties;
import java.io.InputStream;
import java.io.IOException;

/**
 * Prefixes error messages in depot reports with "DOWNTIME: +optionalString+: "
 * if the resource the report ran on is in downtime.   Resources are determined
 * to be in downtime if they are listed in a downtime properties file.  In order
 * to reduce overhead, the downtime properties file is retrieved and cached at
 * a refresh interval in the getDowntimes() method instead of being retrieved
 * for each filter instance.
 */
public class DowntimeFilter extends edu.sdsc.inca.depot.util.ReportFilter {
  private static Logger logger = Logger.getLogger(DowntimeFilter.class);
  private static Properties downtimes = new Properties();
  private static long lastRefresh = 0;

  /**
   * Returns cached property list of resources in downtime.  Gets and caches
   * property list from file in classpath (downtime.properties) if cache has
   * expired according to refreshMins.
   *
   * The property list file contents can be:
   *
   *  downResource1=optionalErrorMessagePrefixStringForResource1
   *  downResource2=optionalErrorMessagePrefixStringForResource2
   *
   * OR
   *
   *  downResource1
   *  downResource2
   *
   */
  synchronized static Properties getDowntimes()  {
    String downtimePropFile = System.getProperty("inca.depot.downtimeFile");
    if(downtimePropFile == null) {
      downtimePropFile  = "downtime.properties";
    }
    String downtimeRefresh = System.getProperty("inca.depot.downtimeRefresh");
    if(downtimeRefresh == null) {
      downtimeRefresh  = "15";
    }
    Integer refreshMins = Integer.parseInt(downtimeRefresh);
    long minSinceLastRefresh = (System.currentTimeMillis()-lastRefresh)/60000;
    if (minSinceLastRefresh >= refreshMins){
      URL url = ClassLoader.getSystemClassLoader().getResource(downtimePropFile);
      if(url == null) {
        logger.error( downtimePropFile + " not found in classpath" );
      }
      logger.debug( "Located file " + url.getFile() );
      downtimes.clear();
      try {
        InputStream is = url.openStream();
        downtimes.load(is);
        is.close();
      } catch (IOException e){
        logger.error( "Can't load properties file" );
      }
      lastRefresh = System.currentTimeMillis();
    }
    return downtimes;
  }

  /**
   * Writes new report with modified error message to depot if resource is down
   *
   * @return  string with depot report (reporter Stdout)
   */
  public String getStdout() {
    String resourceProp  = getDowntimes().getProperty(super.getResource());
    if (resourceProp != null){
      logger.debug( super.getResource() + " is down " + resourceProp );
      return super.getStdout().replaceFirst(
          "<errorMessage>", "<errorMessage>DOWNTIME:"+ resourceProp +": ");
    } else{
      return super.getStdout();
    }
  }

} |
To use this filter, first write a script that prints the names of down resources to a file called "downtime.properties" in the classpath of the depot (e.g. $INCA_DIST/etc/downtime.properties). If you prefer to call the file something besides "downtime.properties", set the name of the file in your $INCA_DIST/etc/common/inca.properties file:
... inca.depot.downtimePropFile=MyDowntimeFilename ... |
In order to reduce depot overhead, the properties file is retrieved and cached every 15 minutes by default. The caching frequency can be changed in $INCA_DIST/etc/common/inca.properties to a different number of minutes:
... inca.depot.downtimeRefresh=5 ... |
The "downtime.properties" file contents can be something like:
downResource1=optionalErrorMessagePrefixStringForResource1 downResource2=optionalErrorMessagePrefixStringForResource2 |
downResource1 downResource2 |
Next add the inca.depot.reportFilter property to your $INCA_DIST/etc/common/inca.properties file.
... inca.depot.reportFilter=edu.sdsc.inca.depot.util.DowntimeFilter ... |
Finally, restart the depot.
% ./bin/inca restart depot |
11.3.2. All2All Filter
The depot has a ready to use filter called "All2AllFilter" that prefixes error messages in depot reports with "NOT_AT_FAULT: " if the resource the report ran on is not at fault for the "all2all" error and the report is not already prefixed with "DOWNTIME" (see Section 5.9.2 for more information about configuring "all2all" tests). Resources are determined to not be at fault if the summary property that matches their nickname has failed. Summary properties are written for any reports with the "summary.successpct.performance" reporter name.
By default, errors that begin with "NOT_AT_FAULT" are displayed neutrally (see Section 6.10). The all2all filter is included in the inca-depot.jar and is configured by adding the inca.depot.reportFilter property to your $INCA_DIST/etc/common/inca.properties file
... inca.depot.reportFilter=edu.sdsc.inca.depot.util.All2AllFilter ... |
and restarting the depot.
% ./bin/inca restart depot |
11.3.3. Multiple Filters
The depot can apply multiple filters to reports. To specify more than one filter, use a comma separated list for the inca.depot.reportFilter property in $INCA_DIST/etc/common/inca.properties:
inca.depot.reportFilter=edu.sdsc.inca.depot.util.DowntimeFilter, edu.sdsc.inca.depot.util.All2AllFilter |
11.4. Depot Database Configuration
The Inca depot uses Hibernate to interface to a relational database backend for storing reports and incat configuration. By default, the Inca depot uses Hibernate's HSQL database but can be configured to use any Hibernate supported database. We have tested the Inca depot with PostgreSQL and Oracle.
Steps for using a depot database other than HSQL are as follows:
Stop the depot
% cd $INCA_DIST; ./bin/inca stop depot
Edit $INCA_DIST/etc/hibernate.properties
Comment out the first 5 lines which specifies for hibernate to use hsql as its backend database:
1 #hibernate.dialect=org.hibernate.dialect.HSQLDialect
2 #hibernate.connection.driver_class=org.hsqldb.jdbcDriver
3 #hibernate.connection.url=jdbc:hsqldb:test
4 #hibernate.connection.username=sa
5 #hibernate.connection.password=
Uncomment the block which specifies for hibernate to use your database (i.e., for PostgreSQL uncomment 8-13, for MySQL uncomment 17-21, for Oracle uncomment 24-28).
Change the uncommented hibernate.connection.url, hibernate.connection.username and hibernate.connection.password property values to be the host/db name, login username and password for your database.
Put JDBC drivers for your database in the $INCA_DIST/lib directory. Driver download locations: PostgreSQL, MySQL, Oracle
Initialize the depot (set up the Inca tables):
You should see something like:% cd $INCA_DIST; ./bin/inca depot -d
Initializing c3p0 pool...
...
Database Initialization Completed
Start the depot
% ./bin/inca start depot
11.5. Depot Fault Tolerance
In order to respond to unexpected depot failure, configure peer depots to mirror each other so that if one fails another can take over. NOTE: the depots must be using a database other than the default hibernate database. There's a bug in hibernate that prevents synchronization. To configure the depot database see Section 11.4.
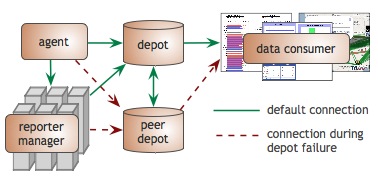
The steps for depots mirroring are as follows:
Install the software for each peer depot
% wget http://inca.sdsc.edu/releases/2.6/incaInstall.sh;
% sh incaInstall.sh $INCA_DIST depot;
Copy the $INCA_DIST/etc/depot*.pem and $INCA_DIST/etc/trusted/* files from the original depot to the peer depot $INCA_DIST/etc and $INCA_DIST/etc/trusted directories respectively. Copy any custom notification scripts or filters from the original depot to the peer.
Edit $INCA_DIST/etc/common/inca.properties on both the original and peer depot and uncomment the blocks which specify the peer hosts for your depots. These should be the full hostname and should not be "localhost" for either. For example, if your original depot is on rocks-101.sdsc.edu:6324 and your peer depot is on cuzco.sdsc.edu:6324, your edits on rocks-101.sdsc.edu would look like:
...
# URIs of peer depots
inca.depot.peers=incas://cuzco.sdsc.edu:6324
...
Edits on cuzco.sdsc.edu would look like:
...
# URIs of peer depots
inca.depot.peers=incas://rocks-101.sdsc.edu:6324
...
Edit $INCA_DIST/etc/common/inca.properties where the consumer and agent are installed and uncomment the block which specifies the hosts for your depots. For example, if your original depot is on rocks-101.sdsc.edu:6324 and your peer depot is on cuzco.sdsc.edu:6324, your edits would look like:
...
inca.consumer.depot=incas://rocks-101.sdsc.edu:6324 incas://cuzco.sdsc.edu:6324
inca.agent.depot=incas://rocks-101.sdsc.edu:6324 incas://cuzco.sdsc.edu:6324
...
Restart the agent and consumer.
Start each new peer depot with the "sync" command below and look for "DB synchronization succeeded" in the $INCA_DIST/var/depot.log files:
% cd $INCA_DIST; bin/inca start depot --sync
Stop the original depot and restart it using the "sync" command below and look for "DB synchronization succeeded" in $INCA_DIST/var/depot.log
% cd $INCA_DIST; bin/inca stop depot; bin/inca start depot --sync
In addition to a redundant depot, the consumer can also be configured for fault tolerance as shown in the figure below.
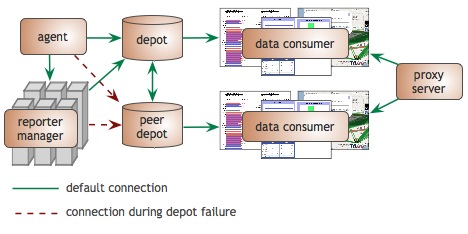
The steps for adding a consumer for each peer depot are as follows:
Install a consumer for each peer depot that doesn't have one (move the inca.properties file if it has already been edited as this step will overwrite it)
% wget http://inca.sdsc.edu/releases/2.6/incaInstall.sh;
% sh incaInstall.sh $INCA_DIST consumers;
Copy the $INCA_DIST/etc/consumer.*pem and $INCA_DIST/etc/trusted/* files from the original consumer to the peer consumer $INCA_DIST/etc and $INCA_DIST/etc/trusted directories respectively. Copy any custom xsl or tag files from the original consumer.
Edit $INCA_DIST/etc/common/inca.properties for each consumer and configure one consumer per depot where each consumer/depot pair are usually on the same machine. For example, if your depot is on rocks-101.sdsc.edu:6324, your edit would look like:
...
# URI to the depot -- use incas:// if auth is required and inca:// if not
inca.consumer.depot=incas://rocks-101.sdsc.edu:6324
...
Configure a proxy server to accept all traffic and direct it to the appropriate consumer address on the internal network.
Restart each depot and consumer using the --sync flag to start the depots.
11.6. Manual Access Method
A resource administrator may be unable to start a reporter manager using one of the automated methods (ssh, globus2, or local). In this case, an Inca administrator can add the resource using the access method 'manual'. The following steps will need to be taken by the Inca administrator and resource administrator:
Inca Administrator
| Step 3: Generate a certificate for the reporter manager. |
| Step 4: Add resource in incat with access method 'manual' |
Resource Administrator
| Step 1: Install reporter manager |
| Step 2: Generate private key and certificate request |
| Step 5: Install certificate and trusted certificate. |
| Step 6: Start reporter manager |
RESOURCE ADMIN: install the reporter manager distribution on your resource using the following steps.
Create an installation directory for the reporter manager (e.g., $RM_INSTALL_DIR). Download the reporter manager tarball and build script:
% cd $RM_INSTALL_DIR; \
  wget http://inca.sdsc.edu/releases/2.6/Inca-ReporterManager.tar.gz; \
  wget http://inca.sdsc.edu/releases/2.6/buildRM.sh
At this point the directory on the remote machine should look something like this:
% ls
Inca-ReporterManager.tar.gz
buildRM.sh
Install the reporter manager and list directories to verify files unpacked correctly:
% bash buildRM.sh $RM_INSTALL_DIR Inca-ReporterManager.tar.gz

% ls $RM_INSTALL_DIR
Inca-ReporterManager-9.6764    build.log    lib    share
Inca-ReporterManager.tar       buildRM.sh   man    var
bin                            etc          sbin
RESOURCE ADMIN: create a set of credentials for the reporter manager (i.e., private key and certificate request) using the command below.
% cd $RM_INSTALL_DIR; ./sbin/inca createRmCertRequest -P stdin:password:Enter a password for your key (to use when you start up the reporter manager). Two files will be created in $RM_INSTALL_DIR/etc: an encrypted private key called rmkey.pem and a certificate request called rmreq.pem. Email rmreq.pem to your Inca administrator and they will generate a certificate for your reporter manager.
INCA ADMIN: upon receiving a rmreq.pem file, generate a certificate for a reporter manager using the command below. Replace "rmreq.pem" with to the path to the rmreq.pem file that you received from the resource administrator and "rmcert-resource.pem" with the path to the reporter manager certificate that will be generated by the command.
% cd $INCA_DIST; ./bin/inca createRmCert -P stdin:password: rmreq.pem rmcert-resource.pemEnter the password for the inca distribution (i.e., created in Step 4 during the initial installation process). Email the reporter manager certificate, "rmcert-resource.pem", and trusted certificate to the resource administrator. The trusted certificate is the file ending with the .0 extension in your $INCA_DIST/etc/trusted directory. For example f73fee74.0 is the trusted certificate in the following directory:
% ls etc/trusted/
agentcert.pem  f73fee74.0  rocks-101.sdsc.educert.pem
INCA ADMIN: add the specified resource within incat and choose 'manual' as below:
Make sure the "Equivalent" box is checked, otherwise the depot may discard reports with "unattached to any DB config" warnings. The new "manualResource" will also need to be added to the "defaultGrid" resource in order to run the default sampleSuite. Select "Agent->Commit" from the menu to commit the changes.
RESOURCE ADMIN: install the certificate and trusted certificate from the Inca admin in your reporter manager installation. Replace "rmcert-resource.pem" and "trusted.0" with the names of the files received from your Inca administrator.
% cd $RM_INSTALL_DIR
% cp rmcert-resource.pem $RM_INSTALL_DIR/etc/rmcert.pem
% mkdir $RM_INSTALL_DIR/etc/trusted
% cp trusted.0 $RM_INSTALL_DIR/etc/trusted
RESOURCE ADMIN: Finally, you can start up the reporter manager using the commands below. Replace "depotHost" with the hostname where the depot is running and replace "manualResource" with the manual resource group name added in step 4:
% cd $RM_INSTALL_DIR
% ./sbin/inca reporter-manager -m \
 -a incas://agentHost:6323 \
 -d incas://depotHost:6324 \
 -c etc/rmcert.pem \
 -k etc/rmkey.pem -t etc/trusted \
 -e bin/inca-null-reporter \
 -r var/reporter-packages \
 -R sbin/reporter-instance-manager \
 -v var \
 -w 1 \
 -i manualResource \
 -L DEBUG \
 -l var/reporter-manager.log \
 -P true
<enter your password>
Command will hang until the password for the reporter manager key is entered. If the private key is not password protected, don't use the -P option in the command above. Check to make sure the reporter manager is running by doing a "ps | grep reporter-manager" and make sure there aren't errors by doing a "grep ERROR $RM_INSTALL_DIR/var/*".
To stop the reporter manager at any time, type
% ./sbin/inca stop reporter-manager
Make sure all reporter-manager ps are stopped
% ps | grep manager
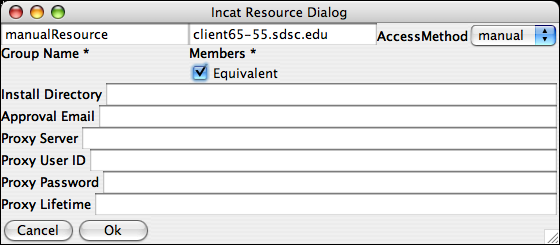
11.7. Batch Systems
The cluster.batch.wrapper reporter can be useful when running Inca on batch systems. Without an --exec argument, this reporter submits a trivial program to the batch scheduler and reporters the amount of time it spends in the queue before executing. If given an --exec argument, cluster.batch.wrapper instead submits the argument value (which should contain a reporter invocation) and collects and reports it output. This use allows reporters to be executed on batch nodes, rather than on the submission host. For example, this command will report the version of gcc that is installed on the batch nodes of a PBS cluster.
% cluster.batch.wrapper --scheduler=pbs --exec=cluster.compiler.gcc.version |
The --scheduler argument is the only one required; valid values are cobalt, dqs, loadleveler, lsf, pbs, and sge. Additional recognized arguments are as follows.
Table 10. cluster.batch.wrapper options
Name | Meaning | Default value |
|---|---|---|
account | User account to charge | none |
nodes | Number of batch nodes to request | 1 |
poll | How often (in seconds) to check for job completion | 10 |
queue | The name of the queue to submit to | none |
shell | The shell to use to run the batch job | /bin/sh |
submitparam | Additional batch-scheduler-specific parameters to use in the submission | none |
timeout | The maximum time (in minutes) the job may wait in the batch queue | 0 (unlimited) |
type | Submission type, used with LoadLeveler (job_type parameter), PBS (-l nodes parameter) and SGE (-pe parameter) | none |
var | Path to a temp file directory | Current working directory |
walllimit | The amount of time (in minutes) to request for the job | 10 |
Here are some additional examples of using cluster.batch.wrapper to submit Inca reporters to a batch queue.
% cluster.batch.wrapper --scheduler=pbs --account=alf63 \ --exec=cluster.compiler.gcc.version % cluster.batch.wrapper --scheduler=loadleveler --queue=normal --type=parallel \ --exec='network.ping.unit --host=ufo.edu' % cluster.batch.wrapper --scheduler=sge --submitparam='-js 1' \ --submitparam='-l h_vmem=600' \ --exec='cluster.ps.unit --process=init --psargs=-x' |
In incat, you can specify that cluster.batch.wrapper should be used to submit a series by including its name and arguments in the series context string. Inca stores installed reporters in the directory $INSTALL_DIR/bin, so the path to cluster.batch.wrapper will be $INSTALL_DIR/bin/cluster.batch.wrapper. The figure below shows the context string for the network.ping.unit series mentioned above.
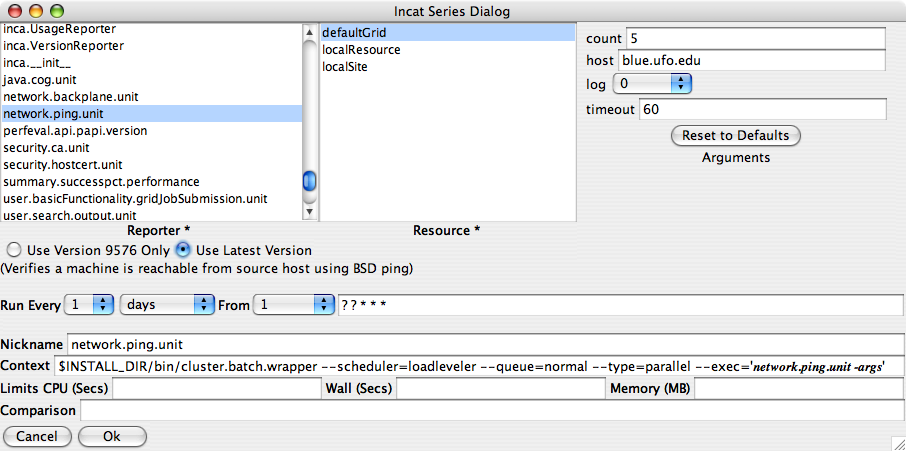
11.8. Manual Run Now
Oftentimes resource or system administrators will want to show that a problem has been resolved by independently executing inca tests before they are scheduled to run so that their results appear on status pages. Rather than granting resource administrators full privileges just to use incat's "run now" button, the inca administrator can provide resource administrators with a "manual run now" option - a command line script to execute tests and send results to the depot. A "run now" can also be invoked via the Inca web pages if configured (by default "run now" is not enabled). See Section 6.5 for more information.
11.8.1. Configuring the Manual Run Now Script
The instructions below need to be done *once* by the Inca administrator on each resource where the resource administrator would like to manually run tests.
To allow system administrators or others to execute tests with their own password, copy the reporter manager key and cert for them and change the password. The old password is the same as the password used in the createauth step of installing inca.
% cd $INCA_DIST/etc; cp rmkey.pem adminkey.pem
% cp rmcert.pem admincert.pem
% chmod 600 adminkey.pem
% ssh-keygen -p

Enter file in which the key is (/home/.ssh/id_rsa):
  /home/incaReporterManager/etc/adminkey.pem
Enter old passphrase:
Key has comment '/home/incaReporterManager/etc/adminkey.pem'
Enter new passphrase (empty for no passphrase):
Enter same passphrase again:
Your identification has been saved with the new passphrase.
Create a custom wrapper script for $INCA_DIST/bin/inca-run-now called $INCA_DIST/bin/admin-run-now using the script below as an example. Use the agent and depot URIs for your installation as AGENT and DEPOT and the agent's name for the resource as RESOURCE. You may need to add the "-u" parameter for the appropriate user if the reporter manager is not running as inca. Run the script with the "-h" flag for more information about its input parameters:
% setenv PERL5LIB lib/perl:$PERL5LIB; bin/inca-run-now -h
Example wrapper script:
#!/bin/sh AGENT=incas://localhost:6323 DEPOT=incas://localhost:6324 RESOURCE=localResource if ( test -z "${PERL5LIB}" ); then PERL5LIB=lib/perl else PERL5LIB=lib/perl:${PERL5LIB} fi export PERL5LIB ./bin/inca-run-now -a $AGENT -c etc/admincert.pem -d $DEPOT \ -k etc/adminkey.pem -P "stdin:password:" \ -t etc/trusted -i $RESOURCE $*(optional)The command to use the admin-run-now script could be added to the reporter details status pages. This would require editing the $INCA_DIST/etc/instance.xsl file on the machine where the consumer is running and adding the xsl required to print a command like:
The xsl would be similar to:% cd /home/inca/inca2install; ./bin/admin-run-now ant-unit
<tr>
  <td colspan="2" class="header">
    <xsl:text>Run now command (system admins only):</xsl:text>
  </td>
</tr>
<tr>
  <td colspan="2">
    <xsl:variable name="repPath" select="$report/reporterPath"/>
    <xsl:variable name="incaloc" select=
      "replace($report/reporterPath, '/var/reporter-packages/bin/.*', '')" />
    <p class="code"> <xsl:text>% cd </xsl:text>
    <xsl:value-of select="$incaloc"/>
    <xsl:text>; ./bin/admin-run-now </xsl:text>
    <xsl:value-of select="$nickName"/></p>
  </td>
</tr>
11.8.2. Using the Manual Run Now Script
Log into the inca account on the desired resource and change to the $INCA_DIST directory.
% cd $INCA_DIST
Execute admin-run-now script using the series nickname as the input parameter and the password from your inca administrator:
You can also print the XML result that gets sent to the Inca server in $INCA_DIST/var/run-now.log by using the "-L DEBUG" flag:% ./bin/admin-run-now ant_version password:********* Started Inca reporter-manager
% ./bin/admin-run-now -L DEBUG ant_version
password:*********
Started Inca reporter-manager
Check for errors in $INCA_DIST/var/run-now.log. Wait about 10-15 minutes to view the result on your inca status page (data is cached and takes a few minutes to update).
(optional)Execute multiple tests: in order to specify that more than one test be executed, use a Perl regex expression instead of the test name like:
% ./bin/admin-run-now <perl regex>
For example, to execute all ant tests
% ./bin/admin-run-now "ant.*"
In order to check your regular expression, you can use the "-l" flag. This option will list the tests but will NOT execute them. For example, to display all ant tests that would be executed:
% ./bin/admin-run-now -l "ant.*"
Suite:  sampleSuite (2 series)
ant_helloworld_compile_test
ant_version
To view all tests, use the regular expression ".*" as below:
% ./bin/admin-run-now -l ".*"
You will notice that test names are listed under a "Suite: <name>" header. You can also use that suite name to execute all of the tests included in it. For example, the following shows the tests available in the sampleSuite kit:
Suite:  sampleSuite (10 series)
ant_helloworld_compile_test
ant_version
gcc_hello_world
gcc_version
java_hello_world
java_version
openssh_version
openssl_version
vtk-nvgl_version
wget_page_test
To execute all test in a kit using the suite name, type:
% ./bin/admin-run-now sampleSuite
Run the script with the "-h" flag for help information:
% ./bin/admin-run-now -h |
11.9. Source Distributions
Source distributions of the Inca components are also available. The following table lists the Inca component source distributions and shows how to build each of them. Note, that Apache Ant is needed for the Inca components implemented in Java.
Table 11. Inca component source distributions
Component | Build |
|---|---|
ant -Dinstalldir=$INCA_DIST install | |
common (used by all Inca Java components) | ant -Dinstalldir=$INCA_DIST install |
ant -Dinstalldir=$INCA_DIST install | |
ant -Dinstalldir=$INCA_DIST install | |
ant -Dinstalldir=$INCA_DIST install | |
make <options> | |
perl Makefile.PL <options> | |
perl Makefile.PL <options> |
12. Component Man Pages
Each of the inca components has options that can be set in either the inca.properties file or on the command line as described in Section 11.1. To see a list components use the bin/inca help command:
% cd $INCA_DIST % bin/inca help Usage: inca <subcommand> [options] [args] Type 'inca help <component>' for help on a specific component Available subcommands: createauth default init help restart start stop version agent depot incat incaws reporter-manager consumer |
For example, here are the options for the depot, agent, reporter-manager, consumer and incat components:
12.1. Depot
% bin/inca help depot java edu.sdsc.inca.Depot P|password str Specify how to obtain encryption password V|version null Display program version a|auth boolean Authenticated (secure) connection? c|cert path Path to the authentication certificate d|dbinit null init depot DB tables h|help null Print help/usage h|hostname str Hostname the server should provide to clients i|init path Path to properties file k|key path Path to the authentication key l|logfile str Route log messages to a file n|numthreads int # threads in worker pool p|port int Server listening port r|remove null remove depot DB tables t|trusted path Path to authentication trusted certificate dir v|var path Absolute path to server temp dir |
12.2. Agent
% bin/inca help agent java edu.sdsc.inca.Agent C|check str check the reporter manager on resources D|depot str Depot specification; host:port H|hostname str Hostname where the server is running P|password str Specify how to obtain encryption password R|refreshPkgs int repository check period for package updates S|server str Server specification; host:port S|startAttempt int re-start attempt period fpr the manager U|upgradeTargets str makefile targets to execute during upgrade V|version null Display program version a|auth boolean Authenticated (secure) connection? b|buildscript str path to reporter manager build script c|cert path Path to the authentication certificate e|email str email to send notices of manager restarts h|help null Print help/usage i|init path Path to properties file k|key path Path to the authentication key l|logfile str Route log messages to a file n|numthreads int # threads in worker pool p|port int Server listening port r|rmdist str path to reporter manager tarball distribution s|stayAlive int stay alive ping period for the manager t|trusted path Path to authentication trusted certificate dir u|upgradeResources str upgrade managers in specified resource group v|var path Absolute path to server temp dir |
12.3. Reporter Manager
% sbin/inca help reporter-manager
Usage:
    reporter-manager [-a|-s] [options]

Options:
    a|--agent
         A string containing the URI to the Reporter Agent process that will
         be responsible for the reporter manager. Either this option or -s
         must be specified. Currently accepted URIs include:

         incas://host:port inca://host:port

    -c|--cert
         A path to a valid certificate file [default: none]

    -d|--depot
         A string containing the URI of a depot to send its reporter data
         to. Currently accepted URIs include:

         incas://host:port inca://host:port file://path

         This option can be specified more than once. The report will be
         sent to the first specified depot. If the first depot is
         unreacheable, the next depots in the list will be tried.

    -e|--error-reporter
         A string containing a path to the error reporter. E.g.,
         inca-null-reporter

    -h|--help
         Print help/usage information

    -i|-id
         The resource identifier supplied by the reporter agent that the
         reporter manager will use to identify itself back to the reporter
         agent.

    -k|--key
         A path to a valid key file [default: none]

    -l|--logfile
         A string containing a path to the file where the log messages can
         be stored. If not specified, log messages will be printed to the
         console.

    -L|--level
         A string containing the log message level (i.e., print statements
         of this level and higher). [default: INFO]

    -P|--passphrase
         Read a passphrase for key from stdin

    -r|--reporter-cache
         A string containing the path to the local cache of reporters.

    -R|--rim
         A string containing a path to the reporter-instance-manager script.
         If not specified, this script will look into the directory where
         itself is located.

    -s|--suite
         A string containing a path to the Inca suite file containing the
         reporters to be executed.

    -t|--trusted
         A path to either a directory or file of trusted certificates
         [default: none]

    -v|--var
         A string containing a path to a temporary file space that Inca can
         use while executing reporters

    -w|--wait
         A positive integer indicating the period in seconds of which to
check the reporter for a timeout [default: 2] |
12.4. Consumer
% bin/inca help consumer java edu.sdsc.inca.Consumer P|password str Specify how to obtain encryption password V|version null Display program version a|agent str URI to the Inca agent a|auth boolean Authenticated (secure) connection? c|cert path Path to the authentication certificate d|depot str URI to the Inca depot h|help null Print help/usage i|init path Path to properties file k|key path Path to the authentication key l|logfile str Route log messages to a file m|maxWait int Max wait time a JSP tag should wait on a cached item r|reload int Reload period for cached objects (e.g., suites) t|trusted path Path to authentication trusted certificate dir v|var path Path to temporary directory |
12.5. Incat
% bin/inca help incat java incat A|agent str Agent specification; host:port P|password str Specify how to obtain encryption password V|version null Display program version a|auth boolean Authenticated (secure) connection? c|cert path Path to the authentication certificate f|file path Inca installation configuration file path h|help null Print help/usage i|init path Path to properties file k|key path Path to the authentication key l|logfile str Route log messages to a file t|trusted path Path to authentication trusted certificate dir |
12.6. Inca Web Services
% ./bin/inca help incaws incaws [opts] depot agent --auth=yes/no --cert=path --help=yes/no --init=path --key=path --logfile=path --password=str --port=int --trusted=path --version=yes/no |
13. Troubleshooting
This section describes some useful tips for troubleshooting problems with an Inca deployment.
13.1. Log Files
The agent, depot and consumer logs are located in the $INCA_DIST/var directory. Reporter manager logs are located in each manager's install directory under the var directory (e.g. ~/incaReporterManager/var).
Logging is informational by default, but can be adjusted to be more verbose ('info' to 'debug') or less verbose ('info' to 'error') by editing the $INCA_DIST/etc/common/log4j.properties file and then restarting inca components. Note that passwords are logged when 'debug' logging is turned on. Logging for the inca components can be adjusted by editing lines 26 and 27 ("log4j.rootLogger=info, stdout" and "log4j.logger.edu.sdsc.inca=info"). To log the most verbose globus error messages change line 33 in log4j.properties from "log4j.logger.org.globus=error" to "log4j.logger.org.globus=debug".
If a reporter manager is not started on a resource after you have scheduled reporters to run there, it is likely the build on that resource failed. You can confirm by looking for "Unable to stage reporter manager to " in $INCA_DIST/var/agent.log. If found, look for errors on the resource in the 2 build log files from the reporter manager build attempt: ~/incaReporterManager/build.log and ~/incaReporterManager/Inca-ReporterManager-*/build.log. The most common build failure is a bad build of the dependency Net::SSLeay which is required for secure communication; the build for Net::SSLeay will fail if it is unable to find OpenSSL on the resource. The Perl SSL modules call the same functions as "openssl verify".
13.2. Authentication Problems
If you observe that a reporter manager on a resource is having trouble connecting to either the agent or depot, there could be a problem with either the installed SSL libraries or certificates. To test, use the pingClient command as in the example below. Replace $RM_INSTALL_DIR with the path to the directory where the reporter manager is installed. Supply the appropriate hostname and port for either the depot or agent. After pressing return, type the password for the certificates.
% cd $RM_INSTALL_DIR % sbin/inca pingClient \ -c etc/rmcert.pem \ -k etc/rmkey.pem -P true -t etc/trusted \ -uri incas://<agent or depot hostname>:<port> <your password> |
If there are no problems contacting either the agent or depot, the exit code will be 0 and nothing will be printed to the screen. If there is an authentication problem, the exit code will be non-zero and a message such as the following will be printed to stderr:
ERROR - Unable to create Inca::IO socket: : IO::Socket::INET configuration failed Error contacting Inca server 'incas://rocks-101:6325' at bin/inca-ping-client line 137, <STDIN> line 1. |
One possible cause of connection problems may occur when the agent does a local lookup of 'localhost' for its hostname but Java doesn't find the fully qualified hostname. An example is when the logged agent hostname is something like 'agent-machine:6323' but should be 'agent-machine.sdsc.edu:6323'. You can override this by adding the fully qualified hostname to your $INCA_DIST/etc/common/inca.properties file on the agent (add 'inca.agent.hostname=agent-machine.sdsc.edu' to inca.properties in this case). Change other properties with 'localhost' values to your fully qualified hostname, e.g.:
inca.agent.depot=incas://depot-machine.sdsc.edu:6324 ... inca.consumer.agent=incas://agent-machine.sdsc.edu:6323 ... inca.consumer.depot=incas://depot-machine.sdsc.edu:6324 |
After you do this, you may need to remove the reporter manager directories on your Grid machines and re-initialize the configuration with the "bin/inca default" command so that new suite names are created with the correct hostname. If you've already invested a lot in your configuration and don't want to re-initialize, email inca@sdsc.edu for help.
Please email inca@sdsc.edu if you are unable to determine the cause of the authentication problem.